
Week 16. Interface and application programming.
During this week I implemented a user interface for my computer to visualize sensor output utilizing different programming languages.
Tasks
- Write an application that interfaces with an input / output device that you made
- Compare as many tool options as possible
Process explanation
UI design
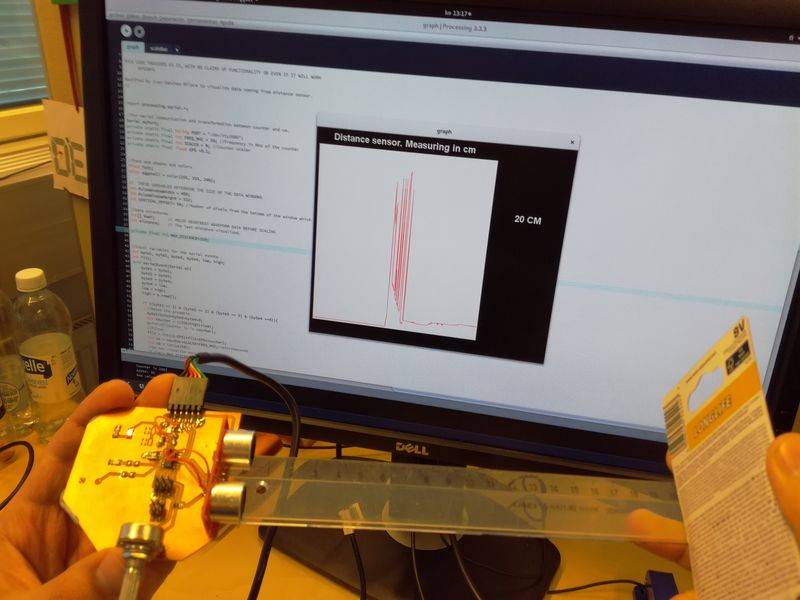
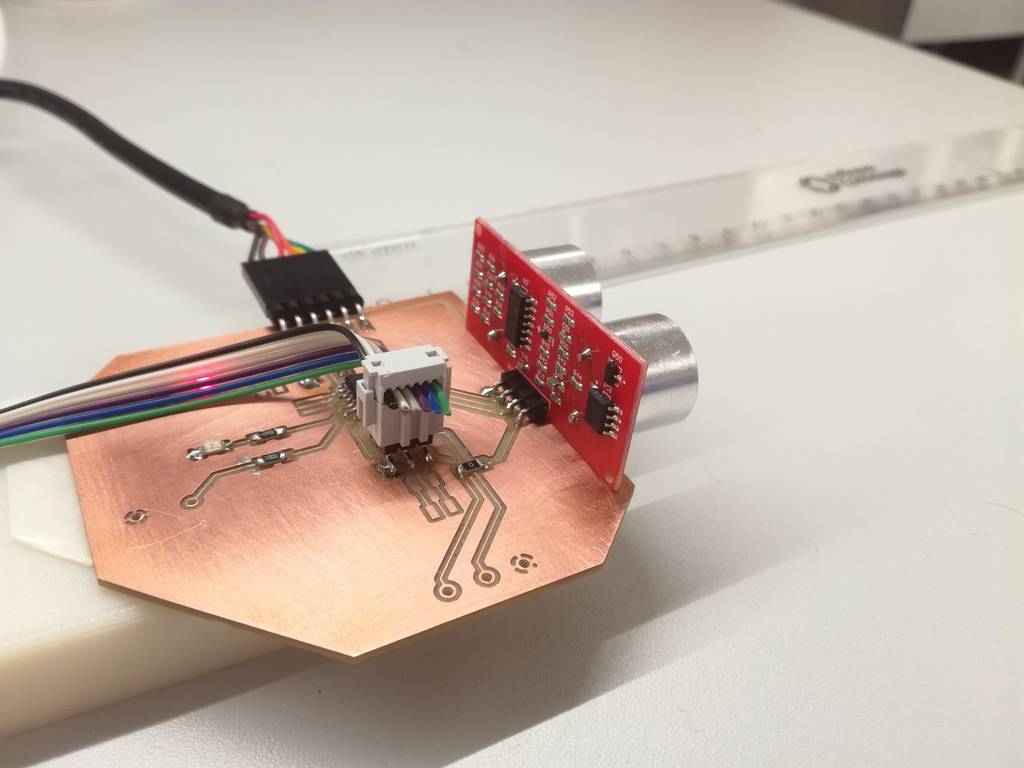
I would like to test a very simple UI interface for the board that I built on Sensor assignments. During this week I build a distance measurement device utilizing a ultrasonic sensor module (Figure 1)
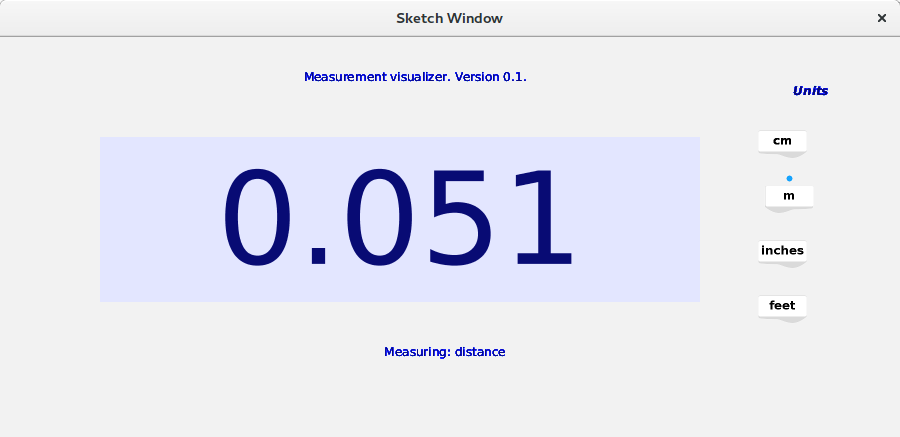
My intention during the week is to implement a very simple UI, that can be reused for my final project. The idea is to provide a basic visualization for the measured distance. The UI should be splitted in two different parts: on the left I would draw a UI similar to the screen in some measurement devices LCD screens, able to show the measure distance, and some controls to modify the measured unit. On the right it should show a time series diagram showing the measures values along time. It should detect maximum and minimum measured values. I am planning to use three different programming languages: Processing, Python and Javascript
. In the end, I did not have time to explore Python or Javascript. I implemented different UI using Processing . But I will try to do the rest in the Future. I have included an extra visualization Volcanothat uses GP4 Processing libraries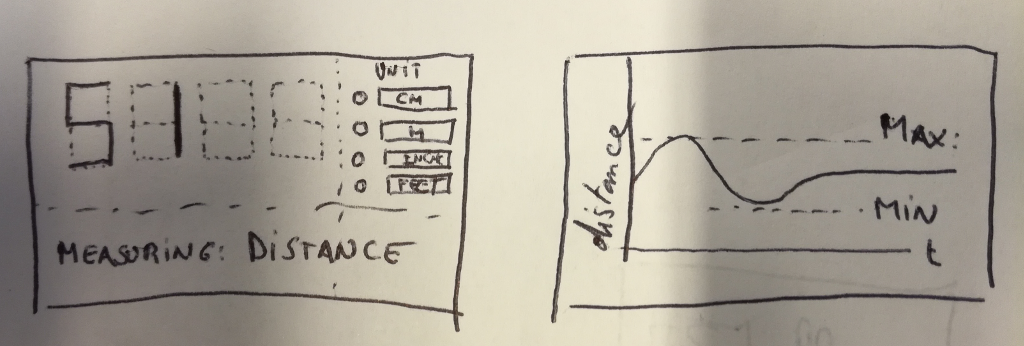
Implementation
PCB code
I took the code from Assignment 13 and made some minor modifications. The code can be obtained through this link.
I utilized the put_char and put_string methods from the lecture's examples. In this case, the board is working to 20MHz (I set properly the fuses as explained in Assignment 8:
- Send a 10us pulse through the trigger port
//
// trigger pulse
//
set(trigger_port,trigger_pin);
_delay_us(10);
clear(trigger_port,trigger_pin);
// wait for echo rising edge
//
high = 0;
TCNT0 = 0;
TIFR0 |= (1 << TOV0);
while (1) {
   if ((echo_pins & echo_pin) != 0) // check for rising edge
      break;
   //If there is a timeout break the while. I need to send a new echo
   if ((TIFR0 & (1 << TOV0)) != 0) { // check for counter overflow
      high += 1;
      if (high == timeout)
         break;
      TIFR0 |= (1 << TOV0);
      }
   }
//
// rising edge found, wait for falling edge
//
high = 0;
TCNT0 = 0;
TIFR0 |= (1 << TOV0);
while (1) {
   if ((echo_pins & echo_pin) == 0) { // check for falling edge
      low = TCNT0;
      break;
      }
   if ((TIFR0 & (1 << TOV0)) != 0) { // check for counter overflow
      high += 1;
      if (high == timeout)
         break;
      TIFR0 |= (1 << TOV0);
      }
   }
if (high == timeout && low == 0){

   continue; //The main loop, do not show anything

}
put_char(&serial_port,serial_pin_out,1);
put_char(&serial_port,serial_pin_out,2);
put_char(&serial_port,serial_pin_out,3);
put_char(&serial_port,serial_pin_out,4);
put_char(&serial_port,serial_pin_out,low);
put_char(&serial_port,serial_pin_out,high);
//_delay_ms(10);
_delay_ms(500);//sampling rate is 2Hz
In order to have bigger range (a counter of 20MHz is too fast, and overflows very fast), I decided to use a preescaler of 8. Hence the effective counter frequency is 20/8=2.5Mhz. To do that the second byte of the TCCR0B should be 1 and the rest 0
// start counter
//
TCCR0B |= (1 << CS01); // prescale /
Processing
Measurement screen
I first downloaded processing from the Processing download page. Accordding to their page Processing is a flexible software sketchbook and a language for learning how to code within the context of the visual arts. Since I wanted to create a GUI I searched in Internet for Processing libraries for GUIs. I found two of them: ControlP5 and GP4. Both claim in their pages that they provide a rich collection of 2D GUI controls for your processing sketch.
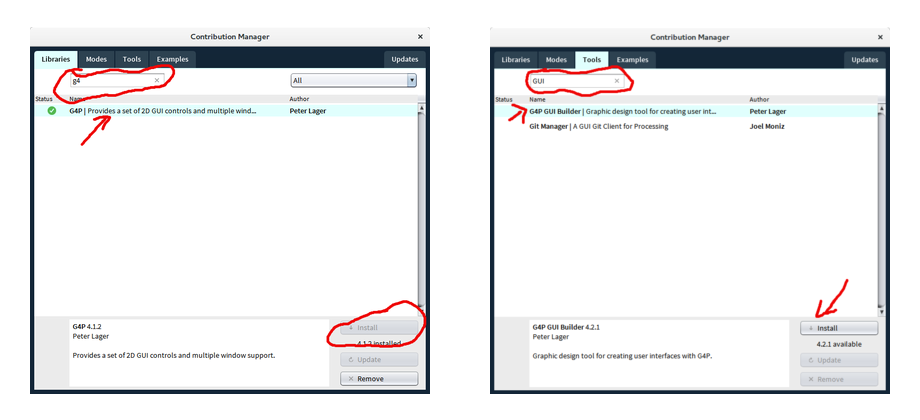
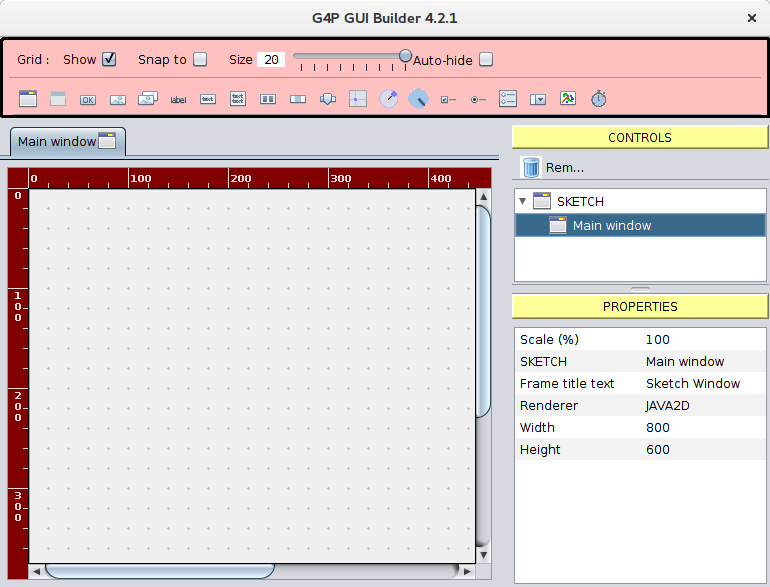
I opted give a try to G4P. Processing environment offers a simple way of installing libraries. You can control the libraries you have installed from the Tool> Add tool command. In there, select the Library tab. In the Filter field write G4P, select the library and press the Install button . In addition to the library, G4P provides a GUI builder tool. To install it follow similar steps: from the Tool> Add tool command dialog, select the Tools, insert GUI in the search field and install the G4P Gui builder.
In Processing, the position of widgets and objects is absolute. Hence, it is easier to use the G4P GUI builder to position the widgets on the screen. First, I created a simple sketch (named Week16 including the signature of the two methods needed in any Processing sketch: draw() and setup(). After that I opened the G4P builder, and it automatically created a new tab in my sketch named gui. When I make changes in the builder, the code will be modified in this file
My main screen will have three widgets: a GTextField to show the valuses coming from the board, a set of Image Toggle Buttons to define the measure unit and a label showing information of what we are actually measuring.
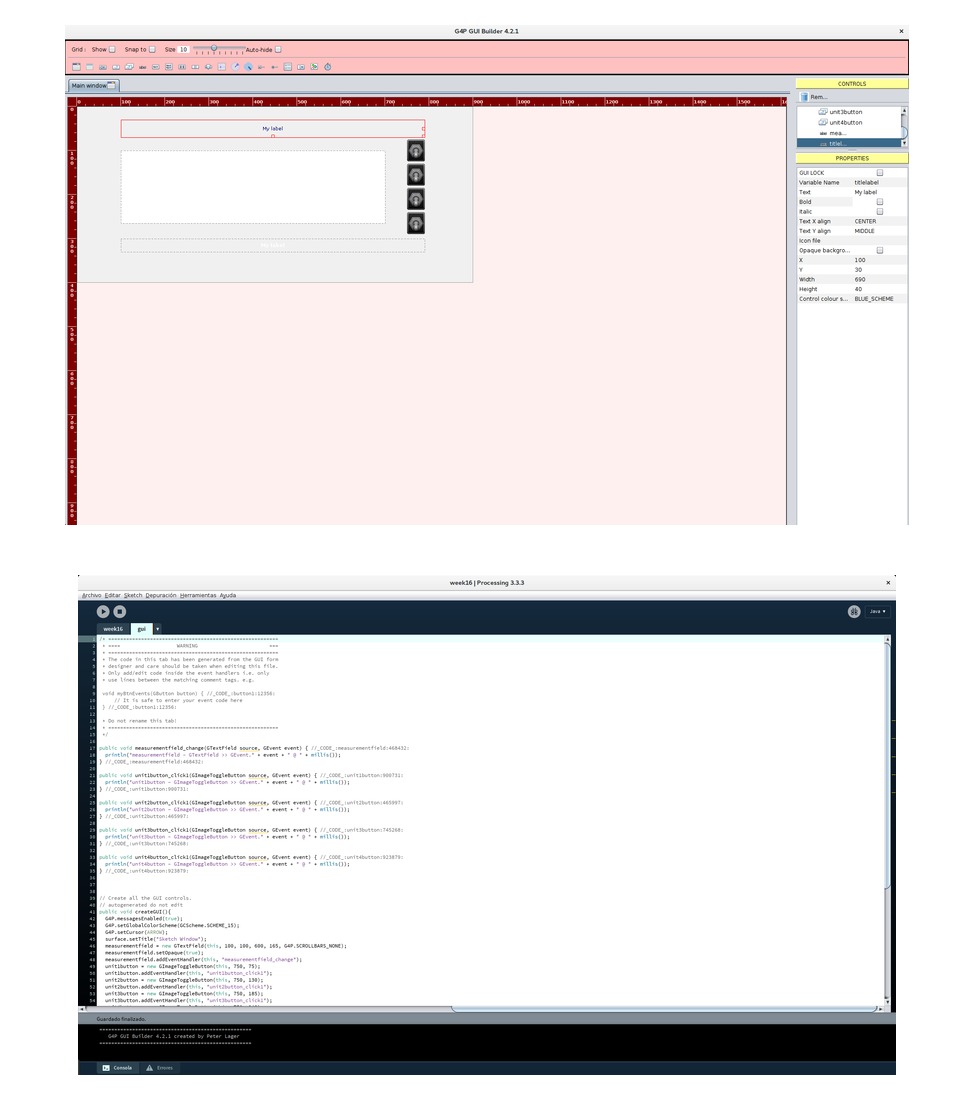
The skeleton of the code looks now like:
import g4p_controls.*;

GTextField measure_field;

public void setup(){
  size(900,400);
  createGUI();
}
public void draw(){
}
After pressing the processing Run button I get the following screen.
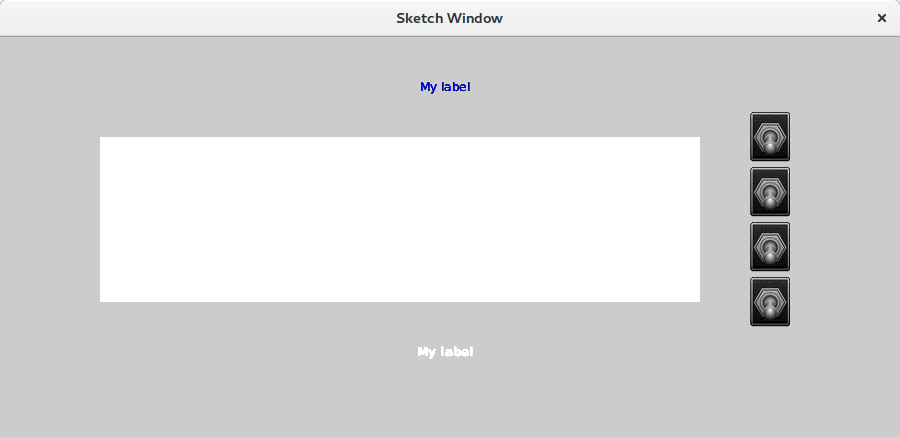
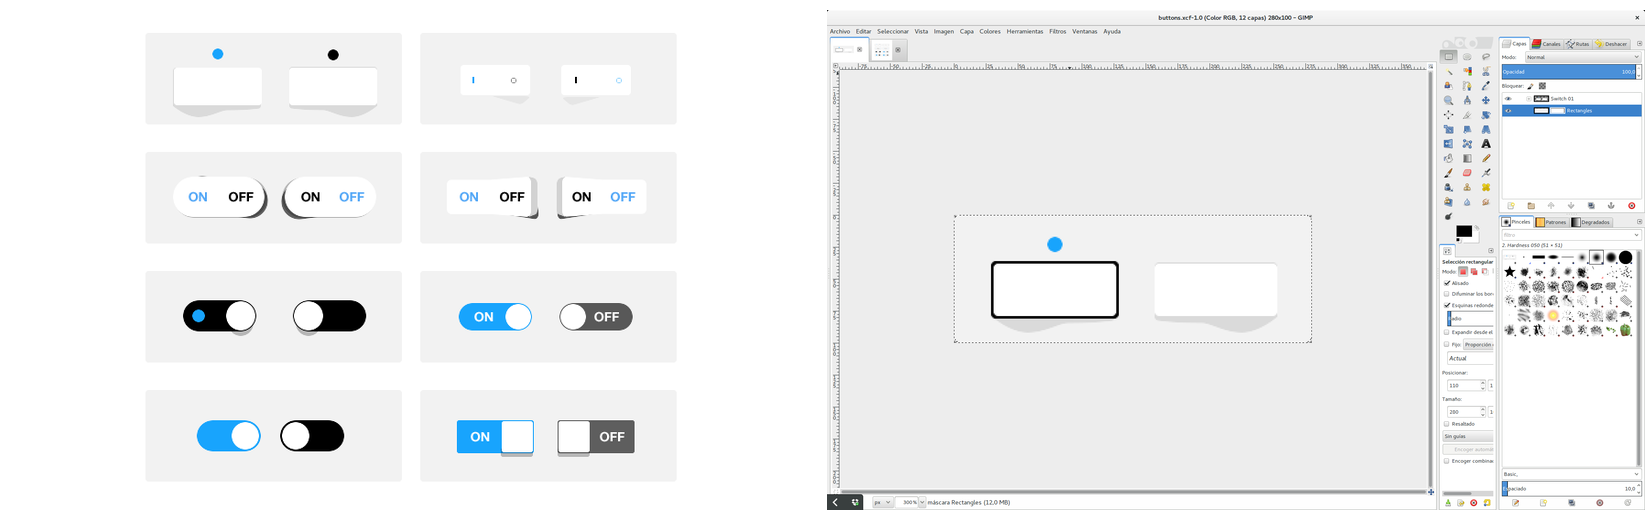
Next, I personalized the UI. For instance, I created my own images for buttons. Actually I downloaded from the web some psd files with toggle buttons in .psd format. In the file came several button models, and I just wanted one, so I have to do some basic work with GIMPto cut the images and export the file as .png file. Before exporting, I created four different buttons, one per unit (cm, m, inches and feet). I added the text using GIMP text tool. The buttons did not look like expected, so I will have to do them again.

Next I implemented the functionality itself. I started with the methods to receive the data from the board. The initialization of the serial port is done in the setup() method. A method that is called only once, when the application is initialized. I just opened the port, utilizing as portName the one written in a constant
import processing.serial.*;
Serial myPort;  // Create object from Serial class
private static final String PORT = "/dev/ttyUSB0";
public void setup(){
  myPort = new Serial(this, PORT, 9600);
  //UI initialization goes here.
}
I implemented the functionality to read the data from the serial bus inside the draw() method, called continously to update the content of the screen. Each time draw is executed it checks if there are bytes available in the serial port. If there are ones they are stored in temporal variables (high, low, byt4, byt3, byte2, byte1 in that order). If those bytes contains the frame structure defined in the PCB (that is (byte1 == 1) && (byte2 == 2) 6& (byte3 == 3) && (byte4 ==4)) then we can go and process the data.
public void draw(){
   while( myPort.available() > 0) {  // If data is available,
    byte1 = byte2;
    byte2 = byte3;
    byte3 = byte4;
    byte4 = low;
    low = high;
    high = myPort.read();

    if ((byte1 == 1) && (byte2 == 2) 6& (byte3 == 3) && (byte4 ==4)){
      //Reset the preamble.
      byte1=byte2=byte3=byte4=0;
      //PROCCESS THE INPUT HERE
    }
  }
}
The received input is processed as follows:
- Extract the counter value:
counter = ((256*high)+low);
filt = int((1-EPS)*filt+EPS*counter);
//    FORMULA=> distance (cm) =(pulse_duration(us)/2) / 29.1 (see http://www.instructables.com/id/Simple-Arduino-and-HC-SR04-Example/)
//          pulse_duration (us) = counter / 20/8 (->frequency: 20Mhz, 20.10^6 ; preescaler=1/8)
//          SO-> d(cm) = (counter/20/8)/58 = counter*8/1160
//
  int us = counter*SCALER/FREQ_MHZ;//microseconds //duration of the pulse in ms
  float cm = us/58; //distance in cm
  println ("Distance is : "+cm +" cm");
 if(unit == CM)
  return Float.toString(cm);
else if (unit == M){
  String val = Float.toString(cm/1000);
  if (val.length()>3){
    val=val.substring(0,4);
  }
  return val;
}
else if (unit == INCHES){
  String val = Float.toString(cm/2.54);
  if (val.length()>4){
    val=val.substring(0,5);
  }
  return val;
}
else if (unit == FEET){
  String val = Float.toString(cm/30.48);
  if (val.length()>4){
    val=val.substring(0,4);
  }
  return val;
}
else return "????";
measurementfield.setText(value)
A video of the system working. Note that the numbers change that slowly because of the filter. I have applied the low pass filter to the counter values. However, it would have been better to apply the filter to the distances themselves. Remember that we calculate the distance from the counter utilizing the formula: distance=counter*8/1160
Graph
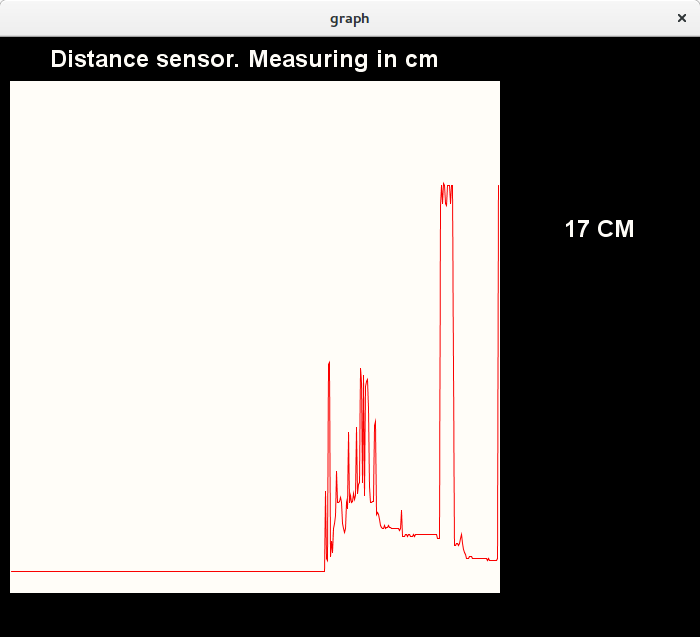
In this case my intention was to represent a time series graph of the values read by the sensor. I decided to limit the values to 120 cm, so values bigger than that are not represented. The graph will be updated everytime I receive a new value from the sensor. As an inspiration I took the code from a Heart Beat Monitor that I found at Instructables and that use a heart beat sensor connected to arduino to measure the beat rate of a person. The data is visualized in Processing.
In this case, I utilized the handy SerialEvent method to receive data from the serial port. Instead of checking in the draw () method if I have some data in the serial port buffer, the Serial Event method is executed. The way of analyzing the preamble and transforming the counter values received from the sensor into cm is similar to the methodology of the previous example (see next code). The value is transformed into cm and the obtained measure is passed to the method updateGraph(int value) to draw the new point into the graph and update it. Note that Serial.read() method returns just one integer with the byte value.
private final int MAX_DISTANCE=300;
private static final int FREQ_MHZ = 20; //Frequency in MHz of the counter
private static final int SCALER = 8; //Counter scaler
private static final float EPS =0.1;
//Local variables for the serial events
int byte1, byte2, byte3, byte4, low, high;
int filt;

void serialEvent(Serial p){
    byte1 = byte2;
    byte2 = byte3;
    byte3 = byte4;
    byte4 = low;
    low = high;
    high = p.read();

    if ((byte1 == 1) & (byte2 == 2) & (byte3 == 3) & (byte4 ==4)){
      //Reset the preamble.
      byte1=byte2=byte3=byte4=0;
      int counter = ((256*high)+low);
      println("Counter is "+ counter);
      //Filter
      filt = int((1-EPS)*filt+EPS*counter);
      int us = counter*SCALER/FREQ_MHZ;//microseconds
      int cm = int(us/58);
      //If distance is bigger than 120, do not visualize.
      //Do not visualize more than MAX_DISTANCE
      if (cm > MAX_DISTANCE){
        cm = MAX_DISTANCE;
      }
      updateGraph(cm)
      println("New value: "+ cm)) ;

    }

}
The port is open in the setup method as in previous examples.
//For serial communication and transformation between counter and cm.
Serial myPort;
private static final String PORT = "/dev/ttyUSB0";
void setup() {
  //Serial communication setup
  //Setup serial communication
  String portName = Serial.list()[0];
  println("Port Name "+ portName);
  myPort = new Serial(this, PORT, 9600);
  //REST OF SETUP CODE HERE
  // ...
  // ...
}
The received values from the sensor are stored in an Array of 512 elements, that it is initialized to 0 in the setup method
RawY = new int[PulseWindowWidth];          // initialize raw pulse waveform array
for (int i=0; i < RawY.length; i++){
  RawY[i] = 0 ; // initialize the pulse values to 0;
}
The key method is the updateGraph method called from the Serial Event. This method stored the recieved value in the distance variable to be visualized later. In addition, it shifts all the elements of the array RawY one position left, leaving a free space at the end of the array that will be filled with the received value. Note that I have used the arraycopy method instead of utilizing a for loop because it is more efficient. In addition, we need to make a simple transformation: The received values from distance range from [0, MAX_DISTANCE] while the Y axis range from [0, windowHeight-Offset]. Hence, we need to scale the value utilizing the map function
void updateGraph(int value){
   distance = value;
   //Add the point to the graph
   //Shift all to the left (new value will be added at the end), instead of using for loop I utilize the arraycopy method that it is much faster.
   int[] buffer = new int[PulseWindowWidth];
   arrayCopy(RawY, 1, buffer, 0, RawY.length-1);
   //Make a map: distance values [0,200], vertical values [0,pulsewindowheight-verticaloffset]
   value = int(map(value,0,MAX_DISTANCE, 0, PulseWindowHeight-VERTICAL_OFFSET));
   buffer[buffer.length-1]=value;
   RawY=buffer;
   println("Added: " +RawY[RawY.length-1] );

}
Finally, the draw method erase the current screen (utilizing drawDataWindows(), and draws again the whole graph (drawPulseWaveForm()). This last method mark the points in the graph as vertex, and then utilizing beginShape() and endShape() the points are moved from the buffer to the screen. Note that the origin of coordinates is at the top-left corner of the window, so to calculate the point in the window I use the formula:
screen_position=window_height-VERTICAL_OFFSET-value_to_visualize.
void draw() {

  background(0);
  noStroke();
  drawDataWindows();
  drawPulseWaveform();

// PRINT THE DATA AND VARIABLE VALUES
  fill(eggshell);                                       // get ready to print text
  text("Distance sensor. Measuring in cm",245,30);     // tell them what you are
  text(distance + " CM",600,200);                           // print the distance


}  //end of draw loop


void drawPulseWaveform(){
  // DRAW THE PULSE WAVEFORM
  // prepare pulse data points

  stroke(250,0,0);                               // red is a good color for the pulse waveform
  noFill();
  beginShape();                                  // using beginShape() renders fast
  for (int x = 1; x < RawY.length-1; x++) {
    vertex(x+10, height-VERTICAL_OFFSET-RawY[x]);//draw a line connecting the data points
  }
  endShape();
}

Finally, a video showing the system working:
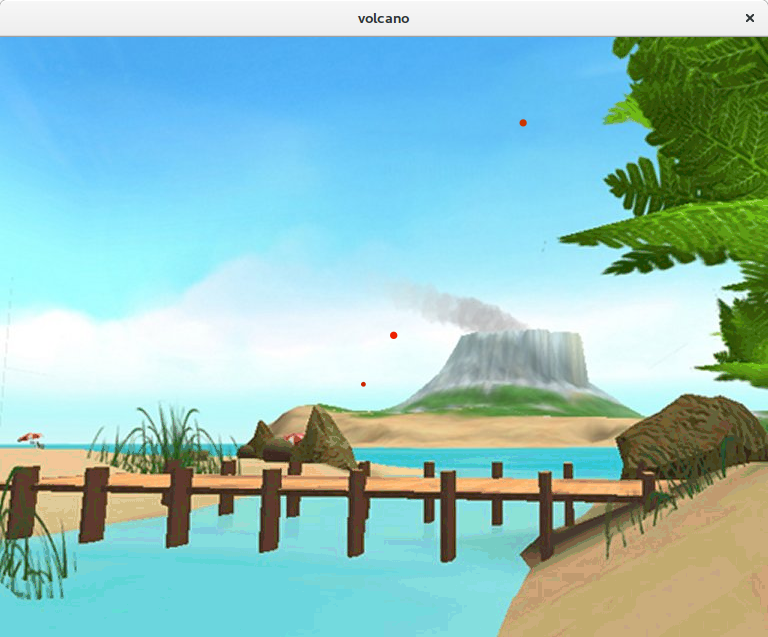
Volcano
For the next visualization I took one Example coming in the G4P library. Its name is G4P timer. In its original form, you can control through a slider in the screen how fast balls leave a volcano drawn in the background. In this application, the idea is to adapt the example so it launches ball faster when you come closer to the volcano.
I started removing all UIs widgets that I did not need such as btnStart, btnStop and sdRate. I removed also the associated handlers. Actually, we are taking the values from the sensor instead from the sdRate. We have defined a variable rate which indicates how often a ball should leave the volcano. Values goes from 1000ms(when the object is far away) to 1ms (when the object is located 1cm or less). The value of this variable is controlled by the distance. The scale factor between distance and rate is 10
In this case, I have used the same SerialEvent method to detect and process the data coming from the serial port as shown in the previous example:
  private static final int FREQ_MHZ = 20; //Frequency in MHz of the counter
  private static final int SCALER = 8; //Counter scaler
  private static final float EPS =0.1;
  private static final int SCALE_FACTOR=10; //Trasnform distance and time.
  //Local variables for the serial events
  int byte1, byte2, byte3, byte4, low, high;
  int filt;

  void serialEvent(Serial p){
    byte1 = byte2;
    byte2 = byte3;
    byte3 = byte4;
    byte4 = low;
    low = high;
    high = p.read();

    if ((byte1 == 1) & (byte2 == 2) & (byte3 == 3) & (byte4 ==4)){
      //Reset the preamble.
      byte1=byte2=byte3=byte4=0;
      int counter = ((256*high)+low);
      println("Counter is "+ counter);
      //Filter
      filt = int((1-EPS)*filt+EPS*counter);
      int us = counter*SCALER/FREQ_MHZ;//microseconds
      int cm = int(us/58);
      //No balls if distance bigger than 120cm.
      if (cm > 120)
        cm = 120;
      timer.setInterval(cm*SCALE_FACTOR);
      println("Current rate:"+ (cm*SCALE_FACTOR)) ;

    }

}
The timer controls how often the volcano throws a ball. With the method timer.setInterval() we update this rate. The timer is defined in the setup method. The constructor receives four different arguments: the current PApplet, the object which contains the function to be executed after the timer, the name function to be executed and the rate (how often it is executed, in ms). Do not forget to start the timer!!!
void setup() {
  //Serial communication setup
  // CODE GOES HERE
  // ...
  //The rate might vary between 1000 (distance of 100cm or more) and 0 (0 cm away) as in the initial example. Let's set initial rate to 1500ms (very slow)
  //Set initial rate to 0
  // Parameter 1 : the PApplet class i.e. 'this'
  //           2 : the object that has the method to call
  //           3 : the name of the method (parameterless) to call
  //           4 : the interval in millisecs bewteen method calls
  timer = new GTimer(this, this, "fireBall", 1500);
  timer.start();
  //UI setup
  //CODE GOES HERE
  //...
}
The rest of the code is similar to the example, you can have it a look in the Processing examples. The code of this Processing application can be obtained from this link.
The PCB board code is similar to the previous example and can be obtained here
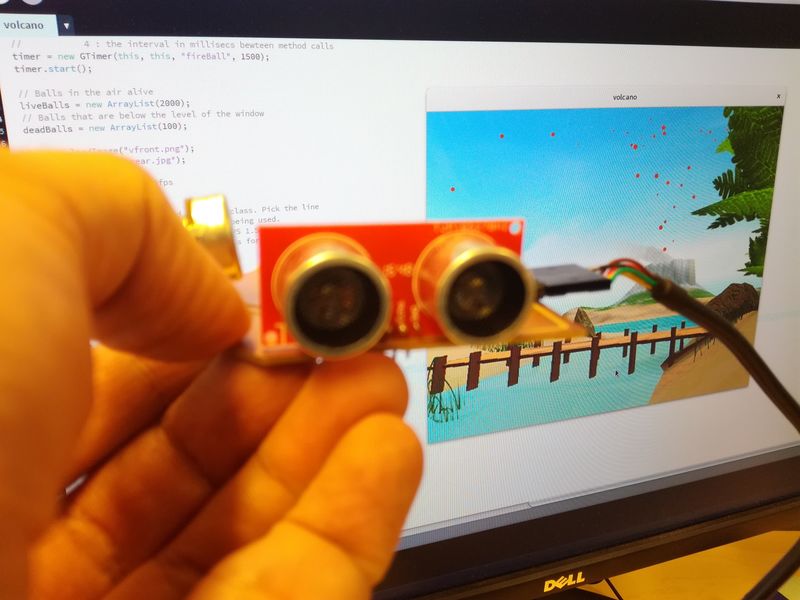
Finally, a video showing the system working:
Python
TBD
Javascript
TBD
TBD
Resources utilized
- Processing framework site and tutorials
- G4P library and site tutorials and examples to build some of the GUIs
Reflection
Summary
I have been programming for long time. I had some experience in Java, Javascript and Python. Not that much on building GUIs. During this week I have created three different UIs to visualize the data coming from a distance sensor that I built for Input devices assignment. My initial plan was to utilize Processing (a language and framework totally new for me), Python and Javascript. However, I spend a lot of time trying to fix some physical problems with the board (documented in Input devices assignment. Basically, the serial port did not work because I shortcircuit GND with the Rx pin. In additioin the lines were so narrow that some of them broke. Finally, I manage to break the FTDI connector. After solving of these issues I did not have that much time for programming. However, I got acquiantance with Processing and G4P a Processing library for building GUIs.
Main learnings
I have learnt a lot trying to solve the problems with the board. Regarding programming I got familiar with Processing framework and G4P library to build GUIs. I think I manage to understand the Processing philosophy and I am able to write quick UIs.
In addition I understood how to connect an application to the PCB board using serial communication. I think that the code I have written for the serial communication both in the PCB and in the application side would be very helpful in the future.
Main difficulties
Not that many difficulties with the programming parts. Perhaps, some issues transforming the result coming from the counte into cm. I had some overflow problems, because some int variables should be long. Otherwise, the main challenges were trying to fix the board and make that the serial communication work correctly.
Models And code
- Sensor's board code: Source code and make file
- For processing: Measurement distance and gui generated using GP4 GUI builder and the data folder
- For processing: Volcano and the data folder
- For processing: Graph and the data folder