2016
Interface and Application Programming May 18. 2016
Processing
This week I made a Processing application interface to my light sensor board I built during the Input devices week. As a starting point, I used the Python script hello.light.45.py from the Input devices week and made a similar serial port reading for Processing. I also used Processing example Storing Input to get the graphical appearance. The resulting code looks like this
import processing.serial.*;
Serial myPort; // Create object from Serial class
int low=0;
int high=0;
int value=0;
int byte1 = 0;
int byte2 = 0;
int byte3 = 0;
int byte4 = 0;
int num = 60;
float mx[] = new float[num];
float my[] = new float[num];
void setup()
{
size(1000, 100);
myPort = new Serial(this, "COM9", 9600);
}
void draw()
{
while (myPort.available() > 0) { // If data is available
byte1 = byte2;
byte2 = byte3;
byte3 = byte4;
byte4 = low;
low = high;
high = myPort.read();
if ((byte1 == 1) & (byte2 == 2) & (byte3 == 3) & (byte4 == 4)){
value = (256*high + low);
println("THE VALUE IS " + value); //print the value to the bottom of the screen
}
background (100);
// Cycle through the array, using a different entry on each frame.
// Using modulo (%) like this is faster than moving all the values over.
int which = frameCount % num;
mx[which] = value;
my[which] = 50;
for (int i = 0; i < num; i++) {
// which+1 is the smallest (the oldest in the array)
int index = (which+1 + i) % num;
ellipse(mx[index], my[index], i, i);
}
}
}
Matlab
Interfacing serial port with Matlab is also quite simple: If your device is connected to port COM9, this is the code that reads the port into 256byte buffer and selects the maximum value. Then the script starts to update the plot figure by adding a new value every time new value is ready. This is a way to collect longer period of history data from a sensor:
a=[];
x=[];
s = serial('COM9'); %assigns the object s to serial port COM9
set(s, 'InputBufferSize', 256); %number of bytes in inout buffer
set(s, 'FlowControl', 'hardware');
set(s, 'BaudRate', 9600);
set(s, 'Parity', 'none');
set(s, 'DataBits', 8);
set(s, 'StopBit', 1);
set(s, 'Timeout',10);
fopen(s); %opens the serial port
w=1;%while index
x=0;
while(w < 50) %50*256 bytes (input buffer)
a=fread(s); %reads the data from the serial port and stores it into the vector a
a=max(a); %store the max of the stored values
x =[x a]; %merge the values into another vector x
plot(x); %plot the vector
axis auto;
grid on;
disp([num2str(t),'th iteration max= ',num2str(a)]);
hold on;
t=t+1; %increase the couter
a=0; %clear the buffer
drawnow;
end
fclose(s); %closes the serial port

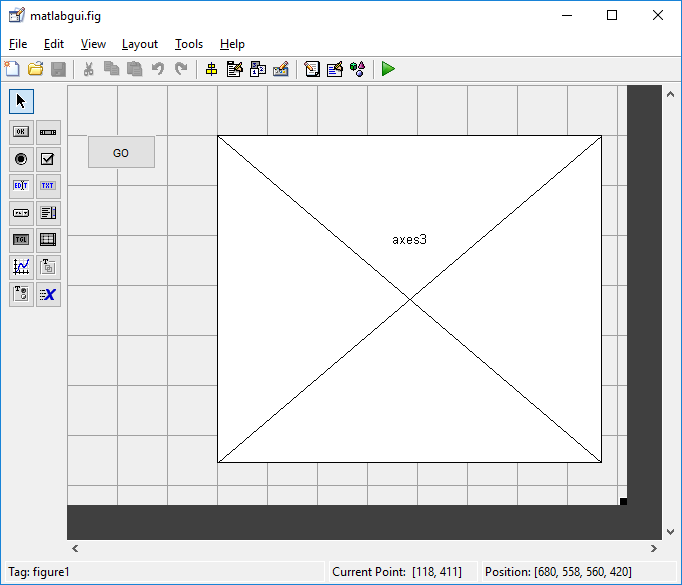
You can also use Matlab GUI tool to make an application window which has control buttons and result fields and graph plots. The Gui editor opens by typing guide in Matlab command window. Here I added a GO button to start executing the script and the result figure placeholder.

After saving this, two files (.m and .fig files are generated. By adding the code above to the generated .m file under the button function code
% --- Executes on button press in pushbutton1.
function pushbutton1_Callback(hObject, eventdata, handles)
% hObject handle to pushbutton1 (see GCBO)
% eventdata reserved - to be defined in a future version of MATLAB
% handles structure with handles and user data (see GUIDATA)
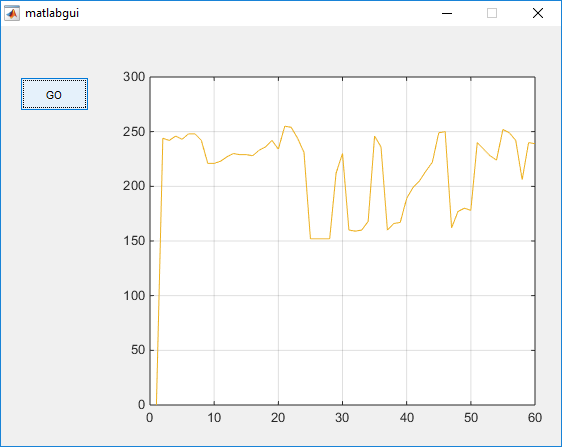
makes a windowed executable code. You can run it by opening the generated fig file and clicking the GO button.

If you decide to interrupt the program prematurely, you need to close the COM port by giving command delete(instrfindall) in Matlab command window.
Files: See the code above
