#15week
interface & application programming
tasks
- - write an application that interfaces with an input &/or output device that you made,
Following last weeks development and assignments, we had to establish an interface/application with one of our devices that we used in a previous assignment. In my case it was the environment sensor DHT11 - it is capable to measure temperature and humidity.
In my last assignments I succesfull embedded the sensorin a setup with my microprocessor board and a LCD display.
Now it was the goal to read the data from the microcontroller an display it on my computer instead on a LCD. So I had to use the serial communication to read in the data to process and to display them in an application window.
For this I decide to go with Python a programming language that has the right libraries for graphical interface. So for this assignment I used the matplotlib library !link to matplotlib in the download section). Matplotlib is a Python 2D plotting library which produces publication quality figures in a variety of hardcopy formats and interactive environments across platforms.
Essential was to declare the correct serial device - in my case it was:ser = serial.Serial('/dev/tty.usbserial-FT9MHVRX',115200)
and then I also added the labels for the x and y axis like:
plt.ylabel('Temperature C')plt.xlabel('Time')
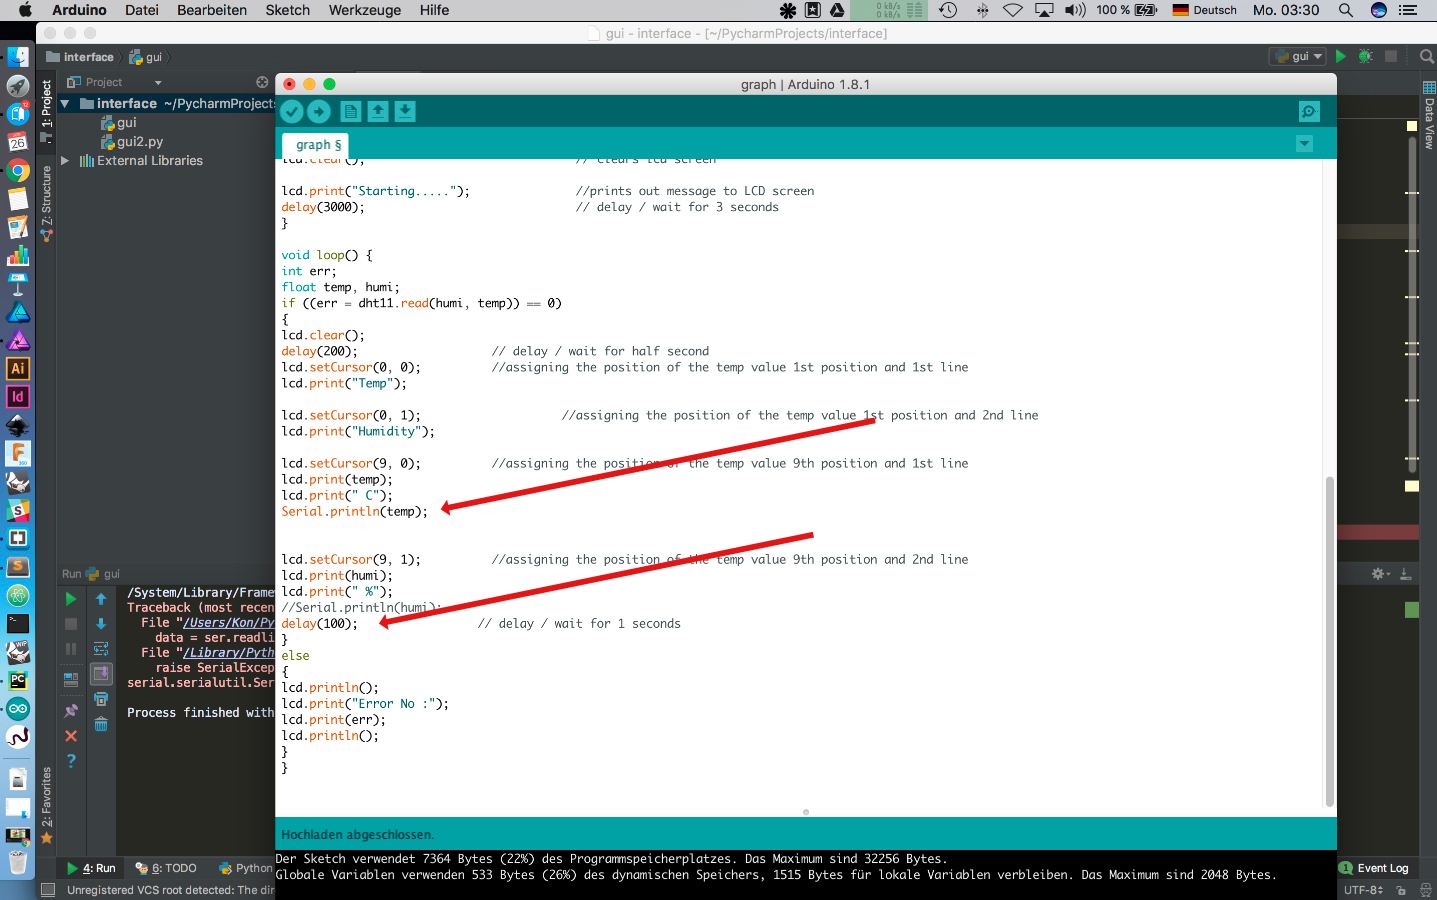 I used the sketch from my IO assignment - just two tiny changes I had to make
 ...Just to be sure that the sensor send data and the serialwrite/read works -a test with the serial monitor
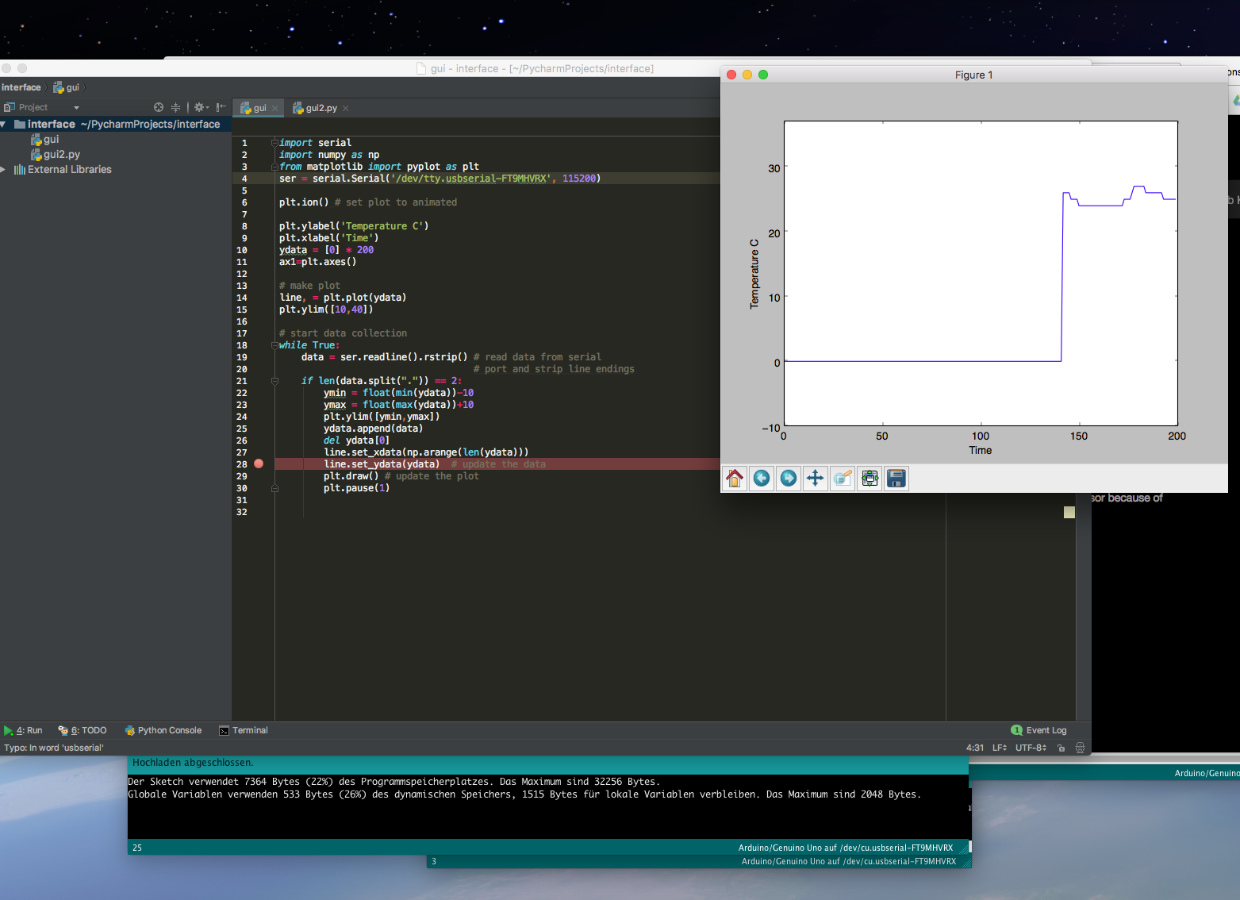 ...and here the screenshot of the working python interface/graph window.
my modified python code for the graph window
import serial
import numpy as np
from matplotlib import pyplot as plt
ser = serial.Serial('/dev/tty.usbserial-FT9MHVRX', 115200)

plt.ion() # set plot to animated

plt.ylabel('Temperature C')
plt.xlabel('Time')
ydata = [0] * 200
ax1=plt.axes()

# make plot
line, = plt.plot(ydata)
plt.ylim([10,40])

# start data collection
while True:
    data = ser.readline().rstrip() # read data from serial
                                   # port and strip line endings
    if len(data.split(".")) == 2:
        ymin = float(min(ydata))-10
        ymax = float(max(ydata))+10
        plt.ylim([ymin,ymax])
        ydata.append(data)
        del ydata[0]
        line.set_xdata(np.arange(len(ydata)))
        line.set_ydata(ydata)  # update the data
        plt.draw() # update the plot
        plt.pause(1)
and the sketch for the sensor
	/*
FAB LAB Test Sketch
FAB ACADEMY 2017
Konstantin Stamatopoulos
Input & Output device
*/

#include <DHT11.h>                         //this is the library for the humidity sensor
#include <Wire.h>
#include <LCD.h>                          //this is the library for the LCD Display
#include <LiquidCrystal_I2C.h>            //this is the library for the LCD I2C communication
LiquidCrystal_I2C lcd(0x27, 2, 1, 0, 4, 5, 6, 7, 3, POSITIVE);
                                          //setting LCD Addr, En, Rw, Rs, d4, d5, d6, d7, backlightpin, polarity

int pin = A0;                             // assigning the pin to the DHT11
DHT11 dht11(pin);

double Fahrenheit(double celsius) {      //Celsius to Fahrenheit conversion
return ((double)(9 / 5) * celsius) + 32;
}

double Kelvin(double celsius) {           //Celsius to Kelvin conversion
return celsius + 273.15;
}

void setup() {
Serial.begin(115200);

lcd.begin(16, 2);                         //initialisation of the LCD screen 16 characters and 2 lines
lcd.backlight();                          // backlight on
lcd.clear();                              // clears lcd screen

lcd.print("Fab Academy 2017");            //prints out message to LCD screen
delay(3000);                              // delay / wait for 3 seconds
lcd.clear();                              // clears lcd screen

lcd.print("Humidity & temp");             //prints out message to LCD screen
delay(3000);                              // delay / wait for 3 seconds
lcd.clear();                              // clears lcd screen

lcd.print("Starting.....");               //prints out message to LCD screen
delay(3000);                              // delay / wait for 3 seconds
}

void loop() {
int err;
float temp, humi;
if ((err = dht11.read(humi, temp)) == 0)
{
lcd.clear();
delay(500);                   // delay / wait for half second
lcd.setCursor(0, 0);          //assigning the position of the temp value 1st position and 1st line
lcd.print("Temp");

lcd.setCursor(0, 1);                    //assigning the position of the temp value 1st position and 2nd line
lcd.print("Humidity");

lcd.setCursor(9, 0);          //assigning the position of the temp value 9th position and 1st line
lcd.print(temp);
lcd.print(" C");
Serial.println(temp);

lcd.setCursor(9, 1);          //assigning the position of the temp value 9th position and 2nd line
lcd.print(humi);
lcd.print(" %");
//Serial.println(humi);
delay(1000);                // delay / wait for 1 second
}
else
{
lcd.println();
lcd.print("Error No :");
lcd.print(err);
lcd.println();
}
}
Resumee
With python I was able to set up an application window to display data from my board and the attached sensor. Meanwhile I know that for the most if not for nearly all tasks somewhere a complete solution in form of ready to use libraries exist. The difficulties for coding / programming beginner like me is to name the function correctly to search for. I guess only time and continously coding will improve my skills.
Like I said I managed to read and display one value in the application window but I didn't found out how to do it yet with both values. And to display them in two seperate windows or graphs. But I will do further research because I have planned to make a Temp/Humidity sensor for home use and to read/dispaly the values on my smartphone or notebook.
Ressources

This work is licensed under a
Creative Commons
Attribution-NonCommercial-ShareAlike 4.0 International License.