Study archive - Week 16
Interface and application programming
The task of the week was to write an application that interfaces with an input and/or output device made previously. I have chosen to make GUI for the temperature sensor.
I have used Python 2.7.11 to program the application and Tkinter. Other python modules necessary to install were PIL, pyserial, numpy.
The basis for data representation was Neils's c code that uses serial communication protocols for reading the temperature data from the microcontroller using ser.read() function.
For the GUI programming, I have used ZetCode Tinkter tutorial code examples.
The picture on the GUI is mine and is released under Creative Commons Attribution 4.0. It can be downloaded from here.
The interface:
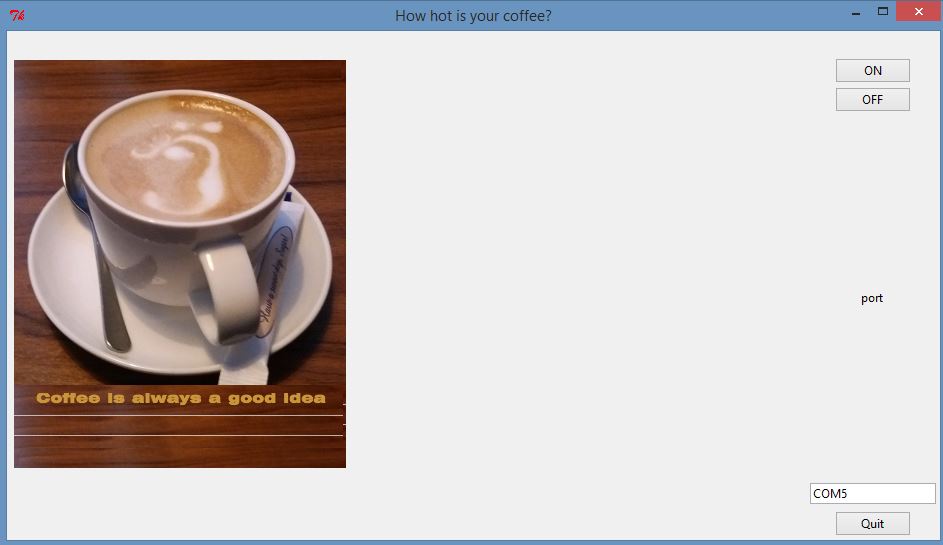
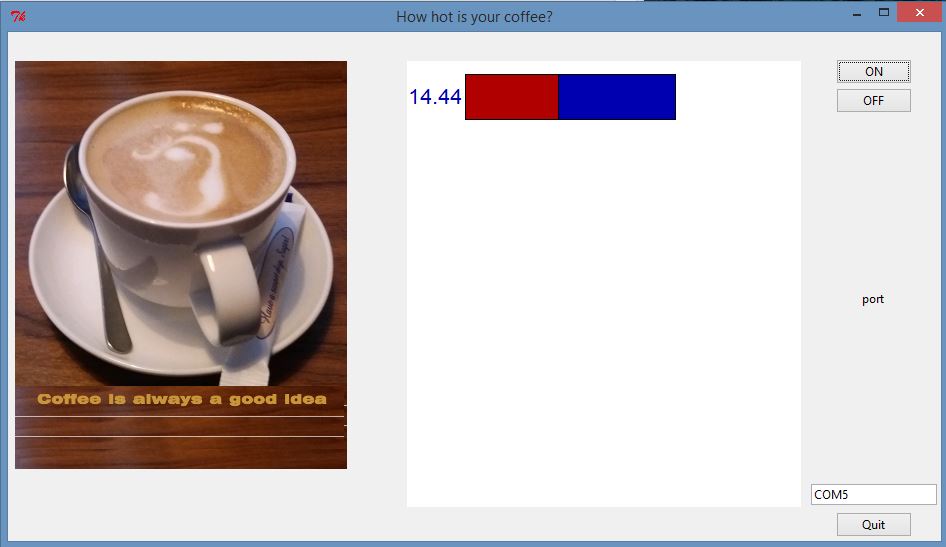
When pressing ON, the temperature is displayed using a graphical representation based on rectangle canvas (the code for this function is slightly adapted from Neil's code hello.temp.45.py).
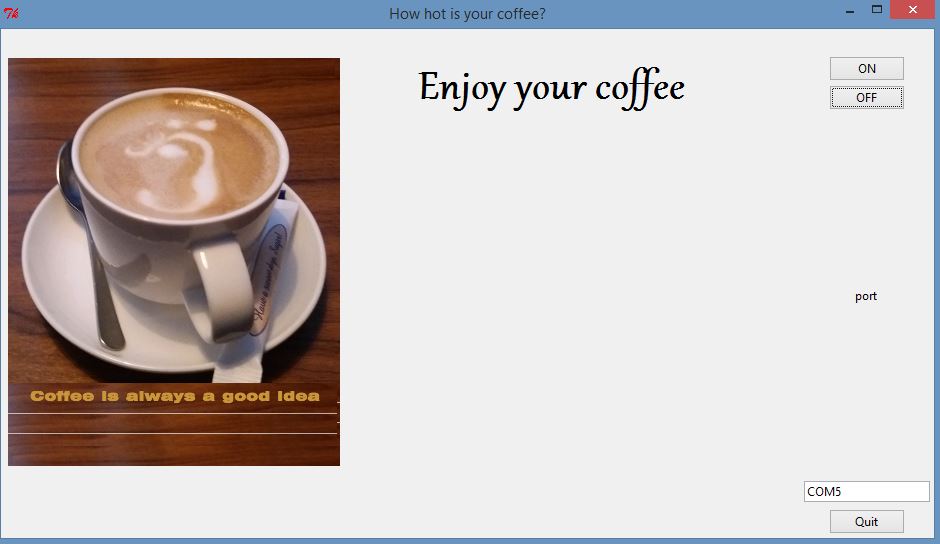
When pressing OFF, the data from sensor is not anymore sent and a message is displayed.
Observe also that you can enter the serial port in a text box, and the program will run accordingly. The default value of serial port is in this case COM5.
A demo video can be downloaded/watched from my google drive.
Click here for Demo Explanation of the codeThe code uses several libraries for processing images, GUI elements and serial communication
from PIL import Image, ImageTk
from Tkinter import sys, Tk, Text, BOTH, W, N, E, S, Label, Canvas, NW
from ttk import Frame, Button, Label, Style, Entry
from numpy import log
import serial
import tkFont
I have added comments in the code for describing the elements of the GUI.
The code related to the temperature display is entirely from Neil's code except that the filter calculation was not possible in this version of Python and thus I had to simplify the formula. Thus the temeprature measurement is not accurate, but the code illustrates the process of calculation and display, and it works with these parameters.
Reading the temperature data from microcontroller pin starts with reading 4 frames and then, when the right succesions of bytes have been read, the two values for the high and low bytes are read too. The two values are combined in one value and this is transformed in degrees Celsius based on the ntc thermistor formula.
    ### see license information in the .py file

              # find framing
              byte1 = byte2
              byte2 = byte3
              byte3 = byte4
              byte4 = ord(ser.read())
              if ((byte1 == 1) & (byte2 == 2) & (byte3 == 3) & (byte4 == 4)):
                 break
           low = ord(ser.read())
           high = ord(ser.read())
           value = 256*high + low
           if (value > 511):
              value -= 1024

           V = 2.5 - value*5.0/(20.0*512.0)
           R = 10000.0/(5.0/V-1.0)
           B = 3750.0
           R25 =  10000.0
           T = 1.0/(log(R/R25)/B+(1/(25.0+273.15))) - 273.15
For displaying the temperature a WINDOW variable is defined that is used to determine the size of rectangles during the online measurement. During measurement, two rectangles rect1 (red) and rect2 (blue) are continuously changing their dimensions based on the temperature read.
### see license information in the .py file
           #filter = filter/2 + T/2  #this did not work so I had to replace it
           filter = T/2  #the displayed temperatue value is not accurate
           x = int(.2*WINDOW + (.9-.2)*WINDOW*(filter-10.0)/10.0)  # I changed filter-20 with filter-10
           canvas.itemconfigure("text",text="%.2f"%filter)
           canvas.coords('rect1',.2*WINDOW,.05*WINDOW,x,.2*WINDOW)
           canvas.coords('rect2',x,.05*WINDOW,.9*WINDOW,.2*WINDOW)
           canvas.update()
           parent.after_idle(idle,parent,canvas)

        p = entry1.get()

        #open serial port
        ser = serial.Serial(p,9600)
        ser.setDTR()

        global ser
        #
        # start plotting
        #
        canvas = Canvas(self, width=WINDOW, height=.25*WINDOW, background='white')
        canvas.create_text(.1*WINDOW,.125*WINDOW,text=".33",font=("Helvetica", 16),tags="text",fill="#0000b0")
        canvas.create_rectangle(.2*WINDOW,.05*WINDOW,.3*WINDOW,.2*WINDOW, tags='rect1', fill='#b00000')
        canvas.create_rectangle(.3*WINDOW,.05*WINDOW,.9*WINDOW,.2*WINDOW, tags='rect2', fill='#0000b0')
        canvas.grid(row=1, column=2, columnspan=2, rowspan=4,padx=5, sticky=E+W+S+N)


        self.after(100,idle,self,canvas)

    def showBlank(self):
        ser.close()
        font_text = tkFont.Font(family='Gabriola',size=36, weight='bold')
        canvas = Canvas(self)
        canvas.create_text(20, 30, anchor=W, font=font_text, text="Enjoy your coffee")
        canvas.grid(row=1, column=2, columnspan=2, rowspan=4,padx=5, sticky=E+W+S+N)
Learning resources
Many other python and tkinter online resources for installation and coding
Summary of the week
I enjoyed this week task and the outcome. I plan to include this type of application in the final project. For that I will do the following improvements: 1) a new data representation; 2) adding time variable in the representation; 3) calibrate the temperature measurement; 4) add error message when the port is not correct.
Summary of Tools used
Software
Python 2.7.11 with the following libraries/modules: pyserial, tkinter, tkinter.ttk, PIL, numpy
The PIL installation for this version of Python worked by installing the exe pil 1.1.7 for python 2.7


