Interface and application programming
Assignment for this week
- Write an application that interfaces with an input &/or output device
- Link to this week’s homeworkpage
Experimenting with serial communication in python
We already went through many example of python interfaces in the Input Devices class.
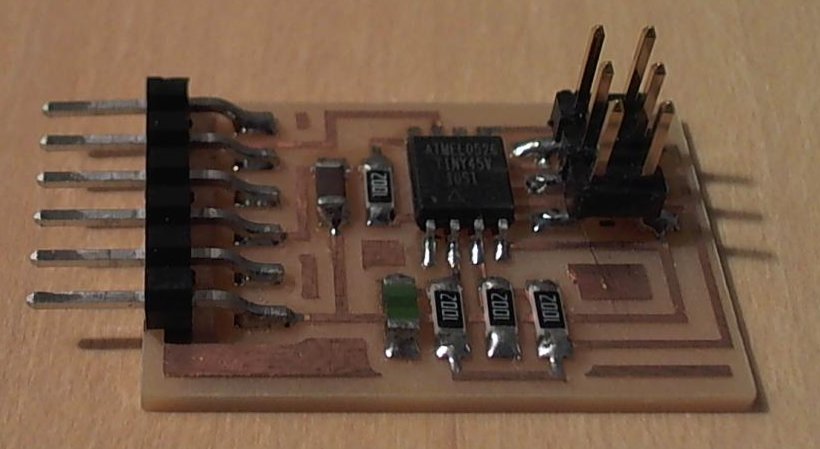
hello.temp board
Since my final project will be about measuring temperature, relative humidity and pressure I decided to experiment interface and application programming with the hello.temp.45 board
Niel already provided us with a python script that uses the pyserial library to read temperature serial communication through the FTDI cable.
#
# hello.temp.45.py
#
# receive and display temperature
# hello.temp.45.py serial_port
#
# Neil Gershenfeld
# CBA MIT 3/27/12
#
# (c) Massachusetts Institute of Technology 2012
# Permission granted for experimental and personal use;
# license for commercial sale available from MIT
#

from Tkinter import *
from numpy import log
import serial

WINDOW = 600 # window size
eps = 0.5 # filter time constant
filter = 0.0 # filtered value

def idle(parent,canvas):
   global filter, eps
   #
   # idle routine
   #
   byte2 = 0
   byte3 = 0
   byte4 = 0
   ser.flush()
   while 1:
      #
      # find framing
      #
      byte1 = byte2
      byte2 = byte3
      byte3 = byte4
      byte4 = ord(ser.read())
      if ((byte1 == 1) & (byte2 == 2) & (byte3 == 3) & (byte4 == 4)):
         break
   low = ord(ser.read())
   high = ord(ser.read())
   value = 256*high + low
   if (value > 511):
      value -= 1024
   V = 2.5 - value*5.0/(20.0*512.0)
   R = 10000.0/(5.0/V-1.0)
   # NHQ103B375R5
   # R25 10000 (O)
   # B (25/85) 3750 (K)
   # R(T(C)) = R(25)*exp(B*(1/(T(C)+273.15)-(1/(25+273.15))))
   B = 3750.0
   R25 =  10000.0
   T = 1.0/(log(R/R25)/B+(1/(25.0+273.15))) - 273.15
   filter = (1-eps)*filter + eps*T
   x = int(.2*WINDOW + (.9-.2)*WINDOW*(filter-20.0)/10.0)
   canvas.itemconfigure("text",text="%.2f"%filter)
   canvas.coords('rect1',.2*WINDOW,.05*WINDOW,x,.2*WINDOW)
   canvas.coords('rect2',x,.05*WINDOW,.9*WINDOW,.2*WINDOW)
   canvas.update()
   parent.after_idle(idle,parent,canvas)

#
#  check command line arguments
#
if (len(sys.argv) != 2):
   print "command line: hello.temp.45.py serial_port"
   sys.exit()
port = sys.argv[1]
#
# open serial port
#
ser = serial.Serial(port,9600)
ser.setDTR()
#
# start plotting
#
root = Tk()
root.title('hello.temp.45.py (q to exit)')
root.bind('q','exit')
canvas = Canvas(root, width=WINDOW, height=.25*WINDOW, background='white')
canvas.create_text(.1*WINDOW,.125*WINDOW,text=".33",font=("Helvetica", 24),tags="text",fill="#0000b0")
canvas.create_rectangle(.2*WINDOW,.05*WINDOW,.3*WINDOW,.2*WINDOW, tags='rect1', fill='#b00000')
canvas.create_rectangle(.3*WINDOW,.05*WINDOW,.9*WINDOW,.2*WINDOW, tags='rect2', fill='#0000b0')
canvas.pack()
root.after(100,idle,root,canvas)
root.mainloop()
To run the script, it is necessary to to invoke
$ python hello.temp.45.py serial_portin a terminal with serial_port the device name corresponding to the FTDI cable ($ ls /dev/tty.usb* to grab it). The code imports the pyserial library (import serial) and really starts at line #64. The port = sys.argv[1] command at line #70 retrieves the name of the serial device (FTDI cable) typed in the terminal while the ser = serial.Serial(port,9600) at line #74 starts a serial communication with the device at 9600 Bauds. Reading from serial can be done in python pyserial using ser.read() for one byte, ser.read(n) for n bytes or ser.readline() to read a line terminated by '\n'. Similarly it is possible to write to serial using commands such as ser.write(b'hello') for instance.
The main window and graphical elements are created using TkInter package (from Tkinter import *) which is a thin object-oriented layer on top of Tcl/Tk. The main window is named root using root = Tk(). Inside this window a canvas is created using canvas = Canvas(...) then text and filled rectangles are added to root. The root.mainloop() command starts the event loop, meaning that python and Tk are waiting for events to perform actions. The root.after(100,idle,root,canvas) allows the idle code defined at the beginning of the script (line #23) to be executed after 100 ms. The code waits for a sequence 1,2,3,4 before reading the value of the temperature (two bytes) at line #42 and #43 and converted into an integer.
low = ord(ser.read())
high = ord(ser.read())
value = 256*high + low
The rest of the code converts the integer into a temperature in Celsius and ajdust the size of the blue and red rectangles created in the canvas according the value of the temperature (the red rectangle becomes longer when the temperature increases).
My plotting python script
I decided to write a python script that plots the temperature allows to save the data in a datafile on the hard drive. Here is the code:
import serial
import matplotlib.pyplot as plt
import numpy as np

connected = False

ser = serial.Serial('/dev/tty.usbserial-FT94TKFS', 9600) #sets up serial connection (make sure baud rate is correct - matches Arduino)

while not connected:
    serin = ser.read()
    connected = True

plt.ion()                    # animation mode

length = 500                 # number of datapoints
y = [0]*length


yline, = plt.plot(y)         # creates the plot

plt.ylim(10,40)              # sets the y axis limits

for i in range(length):     # while taking data
    byte2 = 0
    byte3 = 0
    byte4 = 0
    ser.flush()
    while 1:
      #
      # find framing
      #
      byte1 = byte2
      byte2 = byte3
      byte3 = byte4
      byte4 = ord(ser.read())
      if ((byte1 == 1) & (byte2 == 2) & (byte3 == 3) & (byte4 == 4)):
         break

    low = ord(ser.read())
    high = ord(ser.read())
    value = 256*high + low
    if (value > 511):
        value -= 1024
    V = 2.5 - value*5.0/(20.0*512.0)
    R = 10000.0/(5.0/V-1.0)
    # NHQ103B375R5
    # R25 10000 (O)
    # B (25/85) 3750 (K)
    # R(T(C)) = R(25)*exp(B*(1/(T(C)+273.15)-(1/(25+273.15))))
    B = 3750.0
    R25 =  10000.0
    T = 1.0/(np.log(R/R25)/B+(1/(25.0+273.15))) - 273.15
    y.append(T)   # add new value as int to current list


    del y[0]

    yline.set_xdata(np.arange(len(y)))
    yline.set_ydata(y)


    plt.pause(0.001)                   # in seconds
    plt.draw()                         # draws new plot


rows = y                # combines lists together
row_arr = np.array(rows)               # creates array from list
np.savetxt("/Users/vjmdupuis/temp/data.txt", row_arr) # save data in file

ser.close() #closes serial connection
The code defines the serial interface ser at line #7 (here I put the name of my FTDI cable obtained with ls /dev/tty.usb* ). I use the matplotlib library to create plots and import it as import matplotlib.pyplot as plt. The plt.ion command allows to use the animation mode. I create a list of 500 values intially set to zero at lines #15-16 and then create a plot with a y axis range between 10 and 40. The main loop follows (for i in range(length):). I copied pasted Neil's code (with the 1,2,3,4 framing detection). Once a value of the temperature is read and converted in Celsius, it is stored in the y list (line #53). The plot is then shown with plt.draw() command. This is repeated 500 times. In the end, the y list is converted to an array row_array at line #67 and saved to disk with the np.savetxt(...) command.
Testing
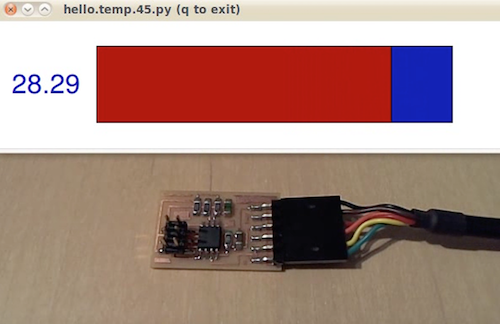
I first plugged everything and rerun the hello.temp python script written by Neil.
$ python hello.temp.45.py /dev/tty.usbserial-FT94TKFS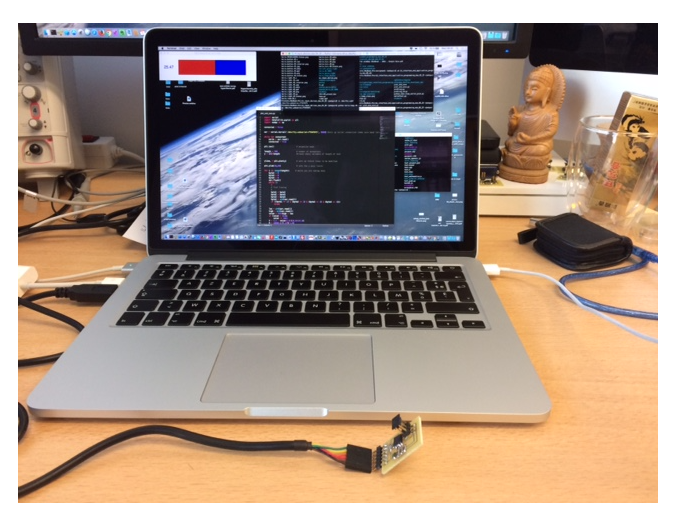
Then, I ran my python script
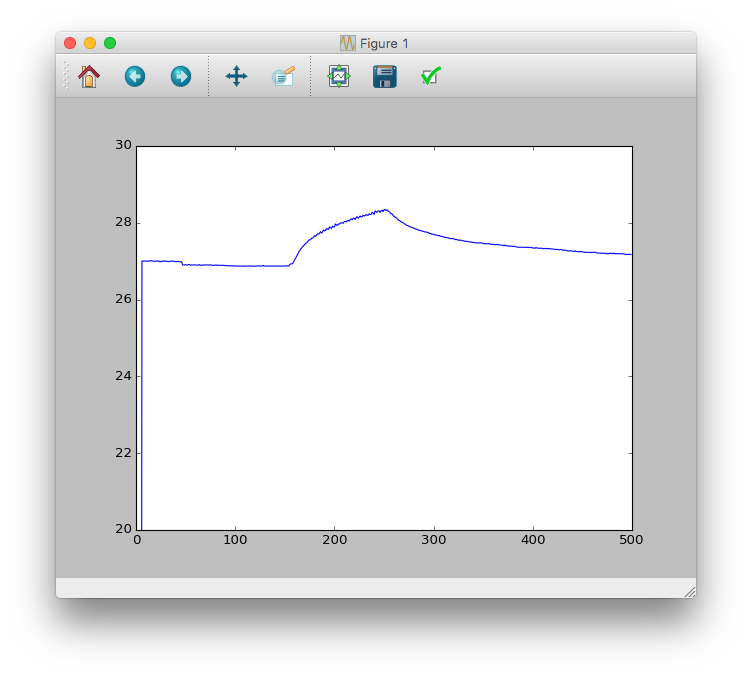
$ python plot_and_save.pyHere is the video:
and a capture of the matplotlib plot:
The script writes the data in my temp directory. I edited the data with sublime:

Ok, the number of digits is impressive and clearly not realistic but it worked.
Mobile application programming
For my final project, I wrote an mobile application that collects data sent by sensors through bluetooth and displays them on the smartphone screen. Please check my project development page.