16.- Interface and Application Programming
May 17
Assignments:
- write an application that interfaces with an input &/or output device that you made, comparing as many tool options as possible
- Goal
- Python
- About the code
- Results
Goal
For this assignment I wanted to graph the temperature of my final project to get an idea that optimum is the temperature curve
Now I am getting the information of the thermistor via serial bus with the cable FTDI.
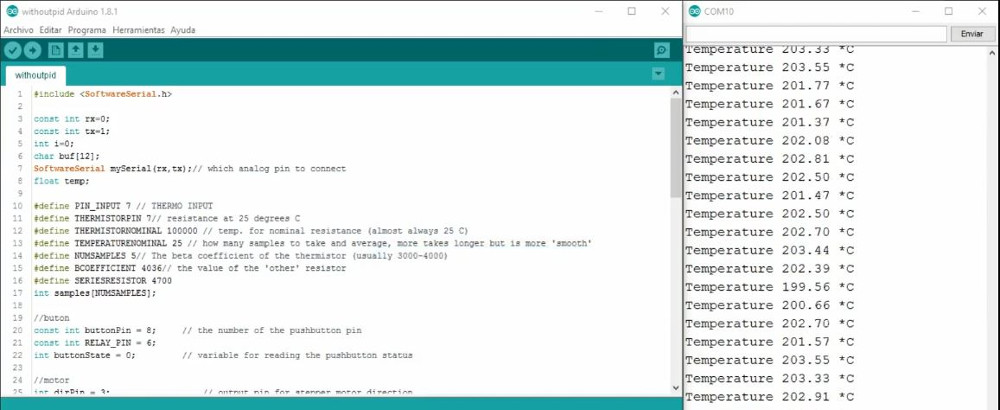
That data I will plot with python instead of the arduino interface so that the information is more visual
Python
Our instructor xavi introduced us to python, explains how to install it and the libraries.
I received advice from Victor Barberan to plot this graph, he recommended using the matplotlib library.github_matplotlib
I also received support from my classmate Esteban Martín Gimenez to install the libraries and to resolve conflicts between python 2.7 and python 3.6
In ubuntu these are the commands that I have used in terminal to be able to execute my code
sudo ./intall.sh
sudo apt-get install python-serial
sudo apt-get install python-matplotlib
pip install pyserial
pip install matplotlib
sudo python simplePlot.py
Other resources I have used during the process are:
Pycharm: Is very complete and allows to execute the python codes from its interface
Sublimetext: Is a very visual text editor but does not allow to run the codes from its interface
Anaconda: Is useful for managing libraries and running the codes
This post helped me to use matplotlib
About the code
In this first part of the code the necessary libraries are imported and the main function is defined
import serial
import matplotlib
import matplotlib.pyplot as plt
import time
import numpy as np
def plotea():
In this case a variable with 101 data (0 to 100) is used.
The position of the data in the variable determines its position on the x-axis and the value of the data determines its position on the y-axis.
Serial communication is defined and activated and the variable is filled until it contains 101 data
def plotea():

    xdata = range(101)

    # get serial port connection
    ser = serial.Serial("/dev/ttyUSB1", 4800)

    # create the list to store data
    dataList = []
    print(len(dataList))

    while len(dataList) < 101:
    	#clean characters and make numbers the data
        data = ser.readline()
    	print(ser.readline())
        dataList.insert(0, float(data))
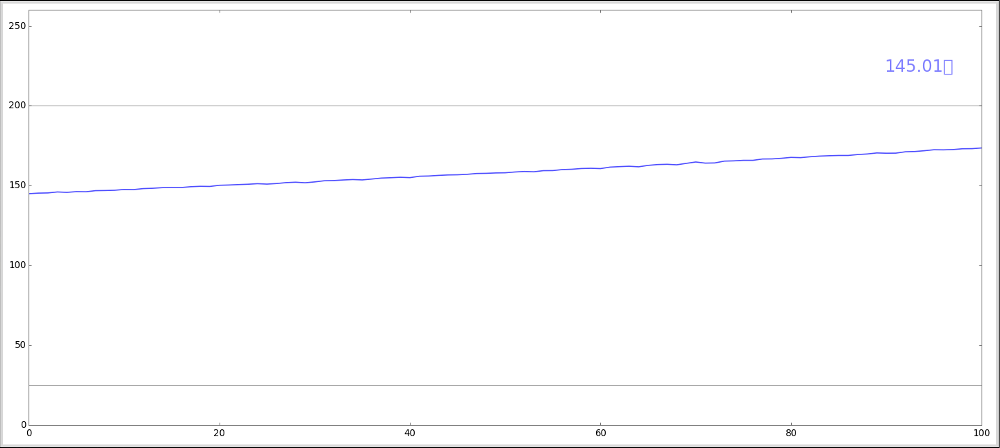
Here are defining two reference lines at 25 and 200 degrees centigrade and defining the appearance of the axes of the graph
l25 = []
    l200 = []
    l25 = l25 + [25]*(101 - len(l25))
    l200 = l200 + [200]*(101 - len(l200))

    #turn interactive mode on
    dataFont =  matplotlib.font_manager.FontProperties(weight='normal', size=22)
    matplotlib.rcParams['toolbar'] = 'None'		#removes ugly toolbar
    fig = plt.figure(figsize=(18,8), facecolor='white')
    ax = fig.add_subplot(111)
    ax.spines['top'].set_color('grey')			#removes visible axis
    ax.spines['bottom'].set_color('grey')		#removes visible axis
    ax.spines['left'].set_color('grey')		        #removes visible axis
    ax.spines['right'].set_color('grey')		#removes visible axis
Now the lines defined above as well as their appearance are drawn, also a text that indicates the current temperature data is plotted
myline, = plt.plot(dataList, color="blue", antialiased=True, lw=1.5, alpha=0.7)
    line25 = plt.plot(l25, color="grey", antialiased=True, lw=1, alpha=0.7)
    line200 = plt.plot(l200, color="grey", antialiased=True, lw=1, alpha=0.7)

    mytext = plt.text(90, 230, '0', color="blue", verticalalignment='top', horizontalalignment='left', fontproperties=dataFont, alpha=0.5, bbox=dict(facecolor='white', edgecolor='None', pad=dataFont.get_size()*0.55, alpha=0.8))

    fig.canvas.draw()
    plt.show(block = False)

    plt.ylim([0, 260])
This last part of the code is responsible for avoiding the delay because if there is data in the buffer are jumped in such a way that there is never data waiting to enter the variable
while True:
        # get data

        while ser.inWaiting() > 0:
             data = ser.readline()
    	     print(ser.readline())
            #data = float(ser.readline().strip("\n").strip("\r"))

             mytext.set_text(data)
            #insert data into list
             dataList.insert(0, float(data))

        # keep list to max 100 values
        while len(dataList) > 101:
            dataList.pop()
            myline.set_ydata(dataList)

        ax.relim()
        fig.canvas.draw()
        fig.tight_layout()


if __name__ == '__main__':
    plotea()
Download the python_code here
Results
In the first video you can check that the time it takes to reach the operating temperature (200º) is approximately 90 seconds. I also intend to show how the led is on when the temperature is rising.
When the 12 volt power is unplugged the graph starts to go down but the communication and the fan are still running thanks to the FTDI cable.
