Final Project: Fabrication
The initial planning for the final project can be found in week 17 assigment page, as well as the project design page. Visit my project showcase to see the final video and presentation slide.
Fabrication Summary
The following summarizes the processes used in the fabrication of the eTester, with reference to the learning outcomes of the Fab Academy. Each component of the fabrication process is detailed below.
Apparatus
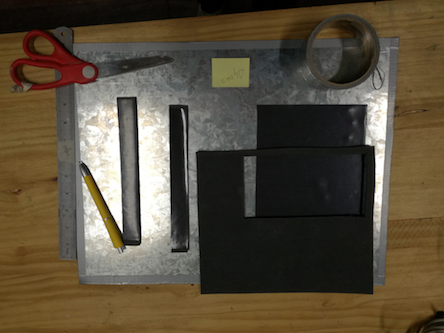
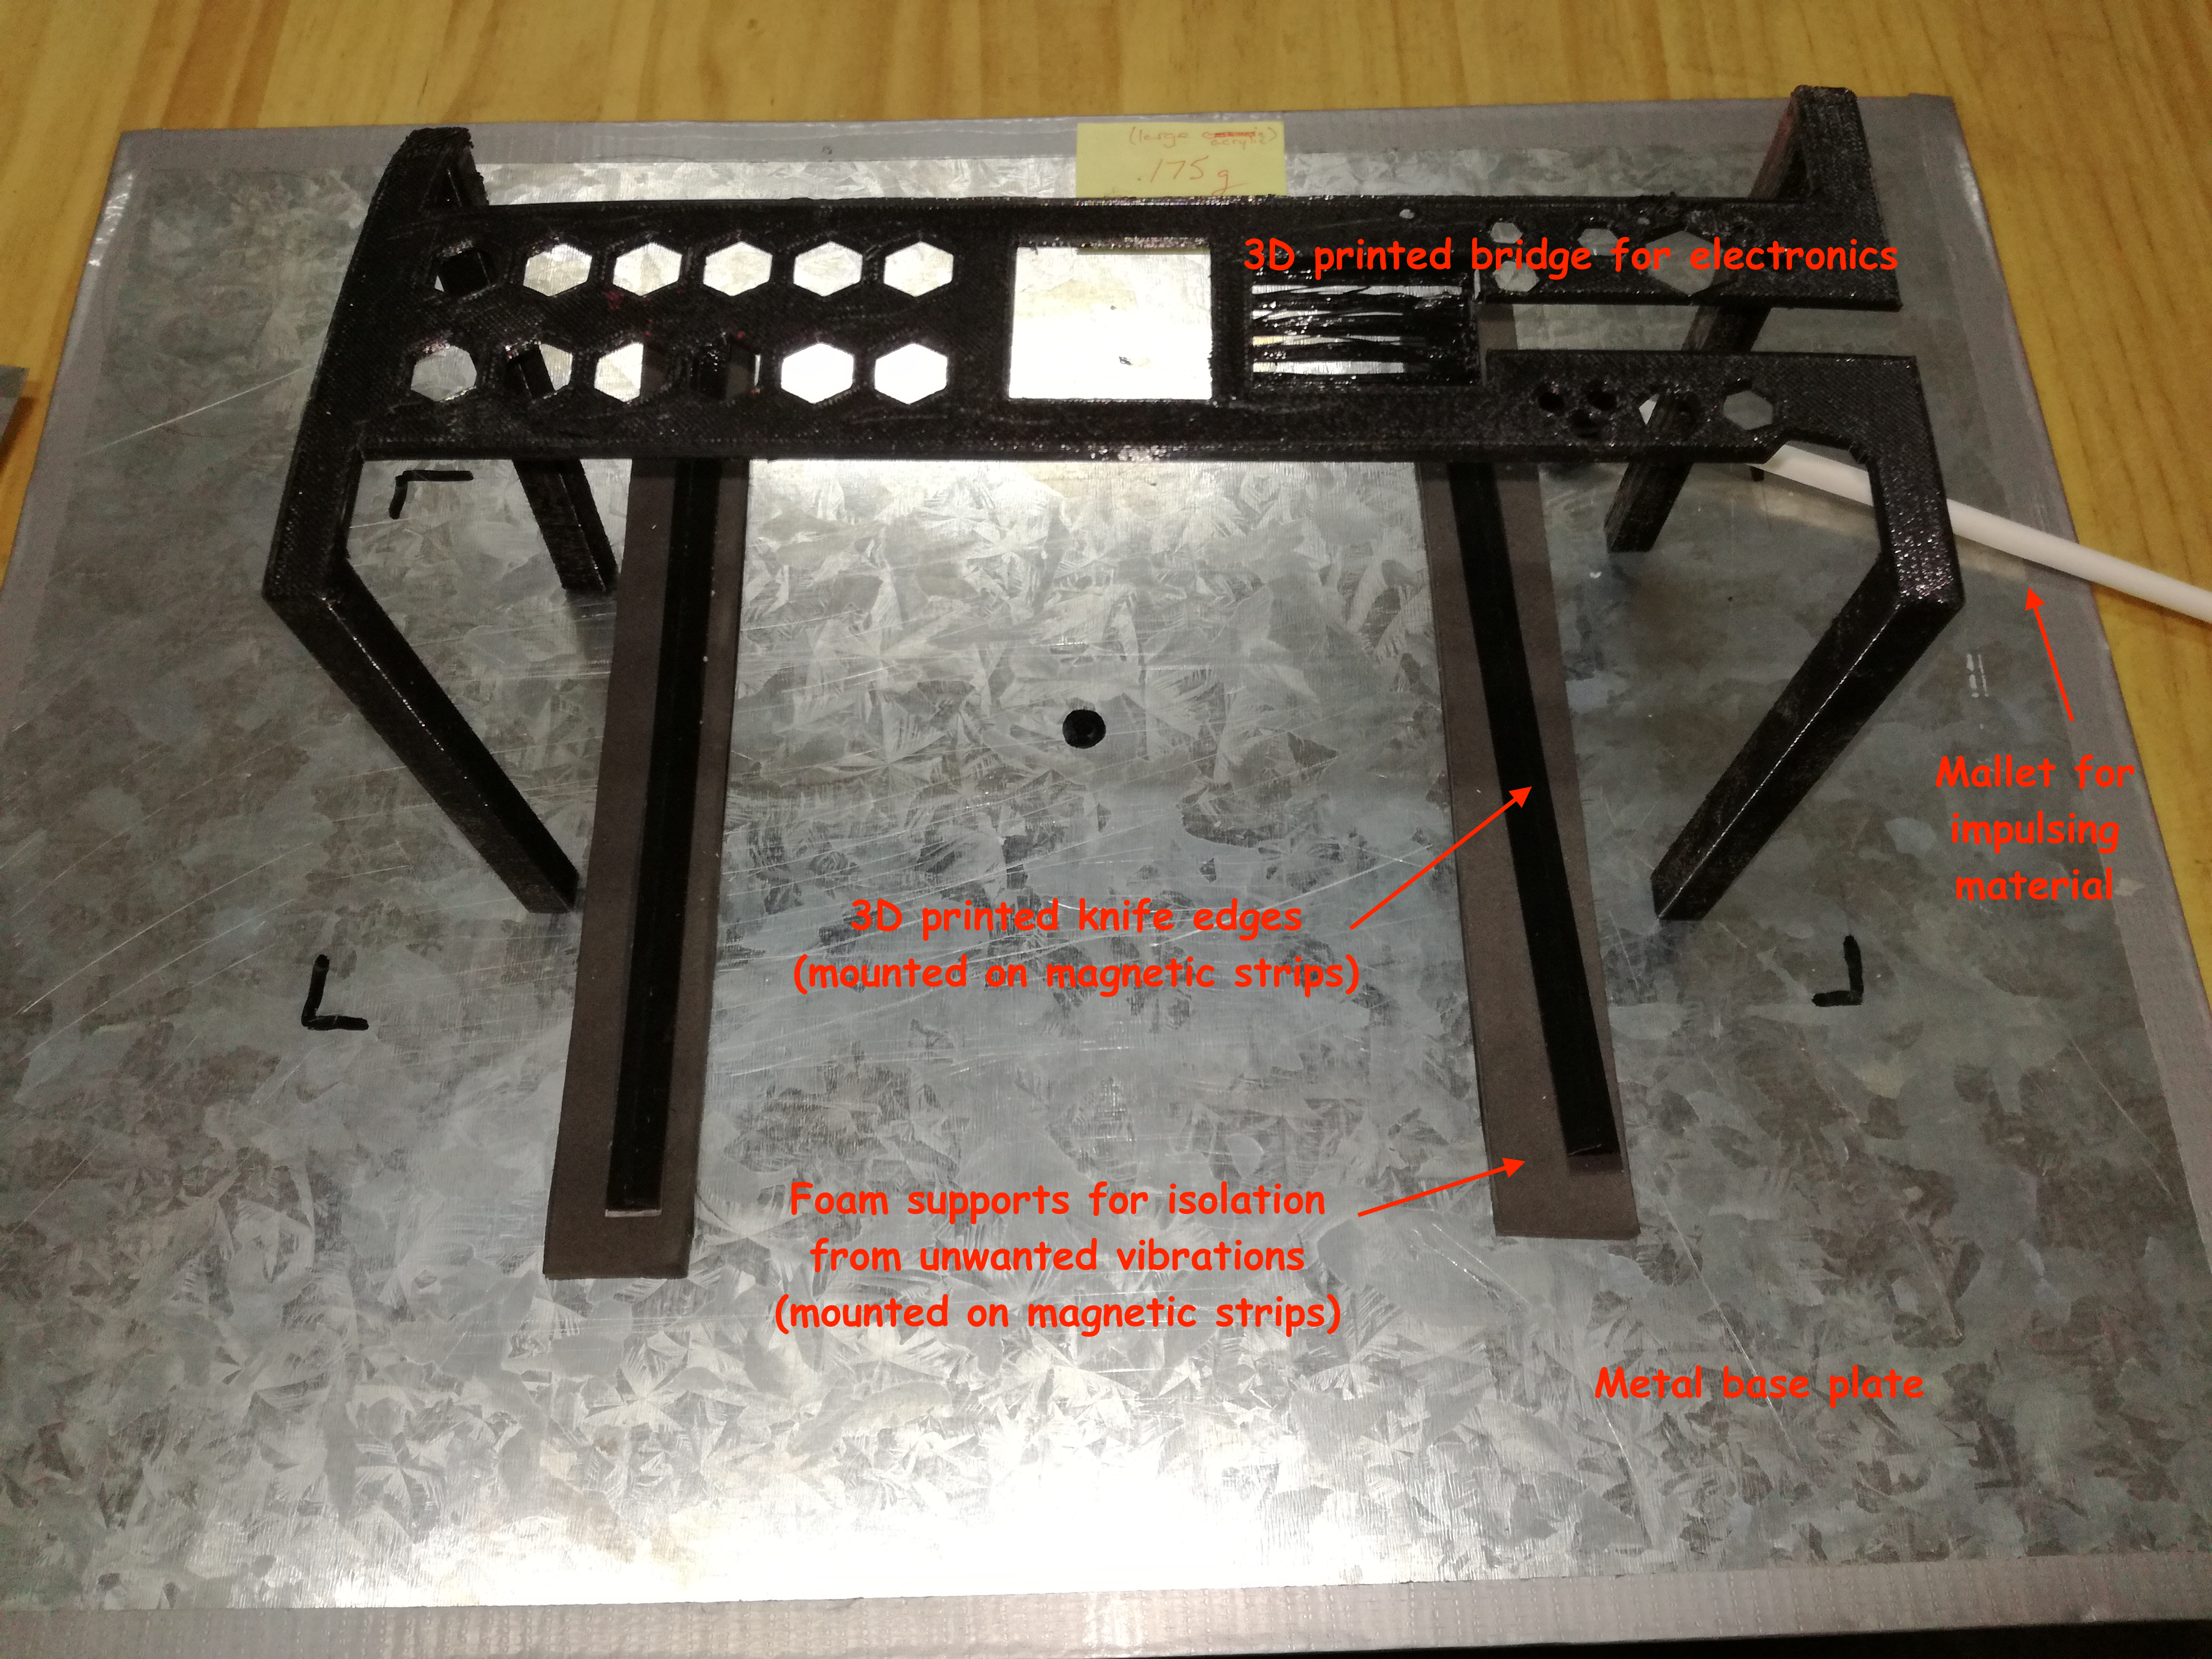
I fabricated the eTester with the following components (pictured below):The image (below) shows the materials I used to create the apparatus
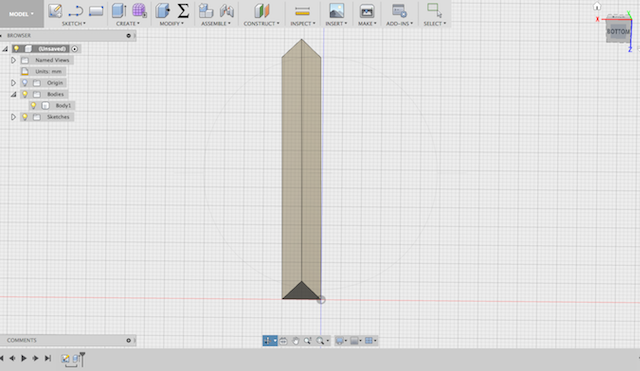
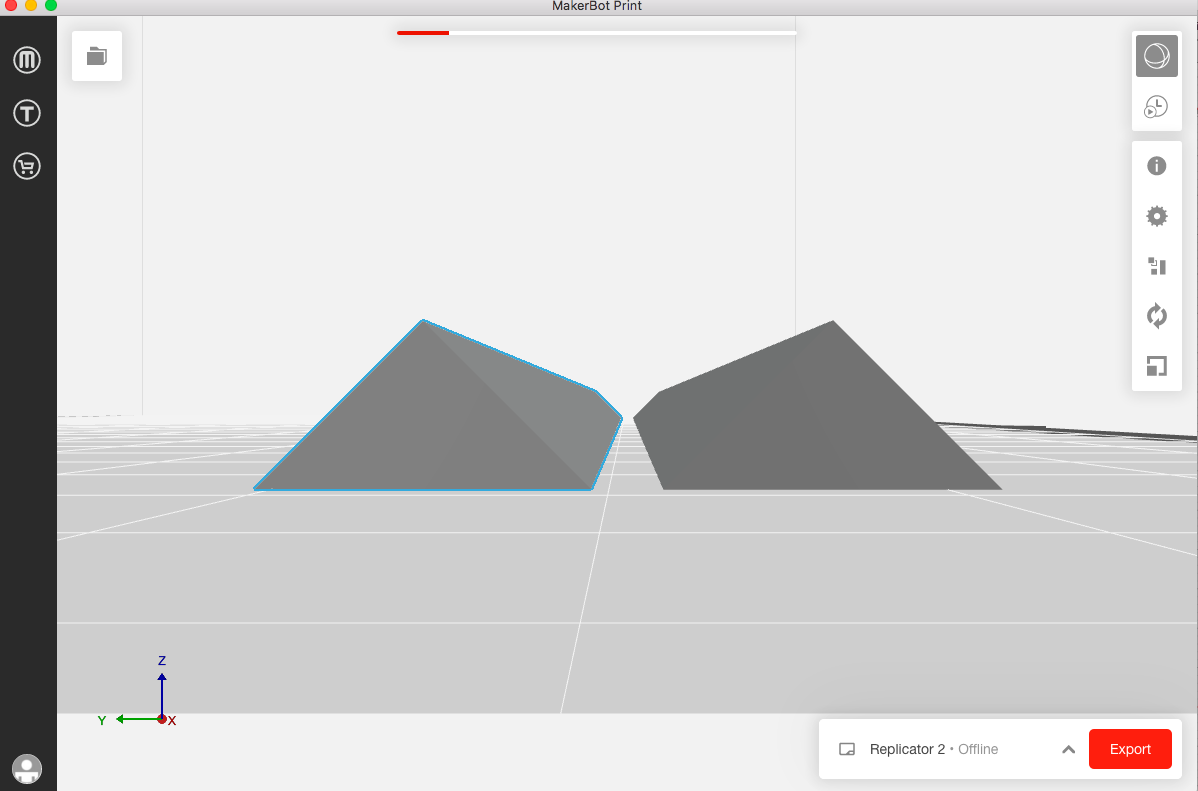
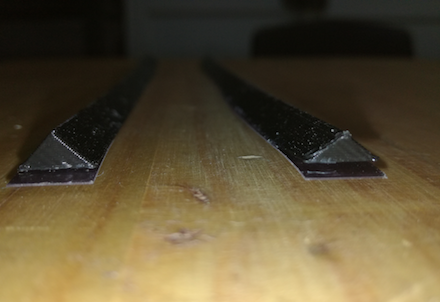
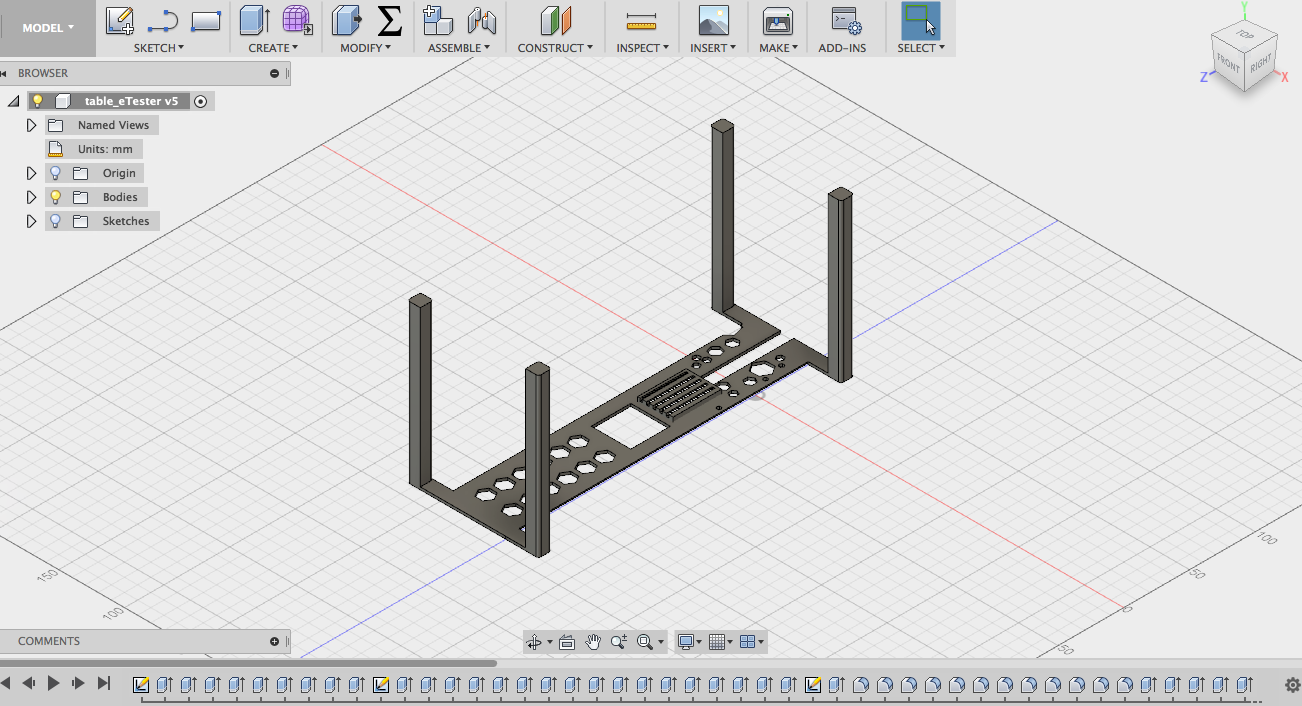
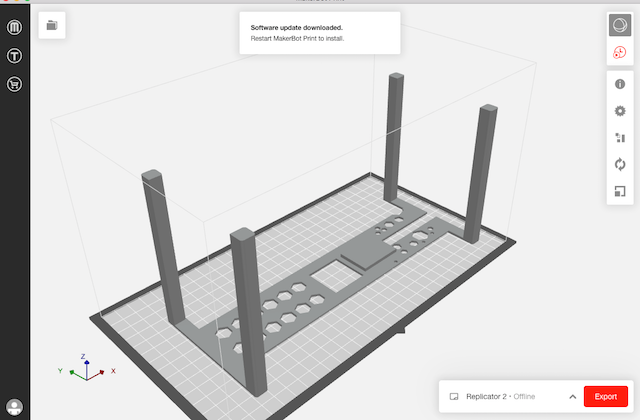
In order to make the system more flexible to different types of materials, I 3D printed knife edges to support more rigid material samples. These edges needed to be mounted on 'isolation pads' so there is no signal interference. The images below illustrate the process of modelling in fusion, loading them into Makerbot software (adding a duplicate in the process of preparing the print job), and then the final printed objects. The printed edges are glued onto magnetic strips so that they can be securely positioned on the metal base of the eTester
In order to integrate the electronics into the eTester I designed and fabricated a 'bridge' for the electronics boards. The following were my design goals:
I designed the following 'bridge' in Fusion, and then 3D printed it with the lab Makerbot.
Sample Preparation
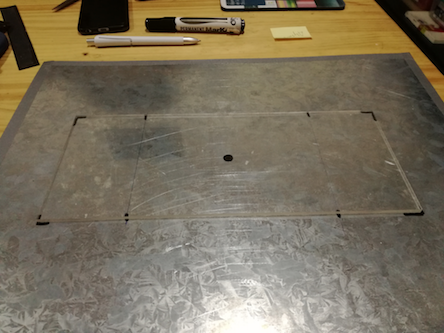
I began with using piece of acrylic as my sample to test the eTester. It is a perfect rectangular shape (required by the testing method), and I measured the dimensions as 128mm x 302 mm x 4mm. To calculate where the sample should rest on the aparatus, I calculated .224 x L = 67.648 mm from the ends of the samples on either side. You can see in the picture below these node lines drawn, together with the center point where the sample should be struck.
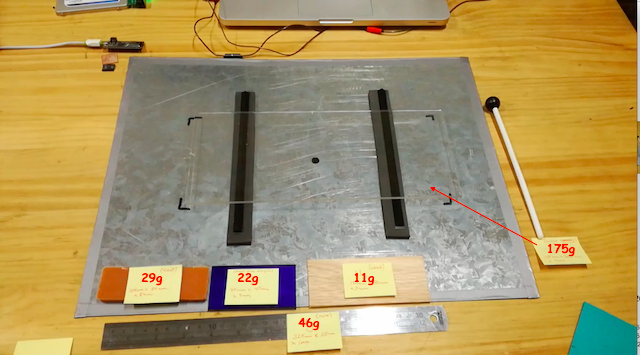
When testing each sample, the mass is a key input variable in the calculation of the elastic modulus.
The final setup of the apparatus is shown below, with the sample of acrylic in place.
Electronics:
The electronics system has three components: (1) a hit detector PCB board that detects the hit of the mallet on the material, (2) a microphone board that listens to the vibrations of the material sample, and (3), an adafruit PBC that listens to the microphone, samples the data, and sends it to the computer. The following explains the fabrication of each part of the system.
Hit detector PCB
The Hit Detector board was designed and fabricated with the following components:
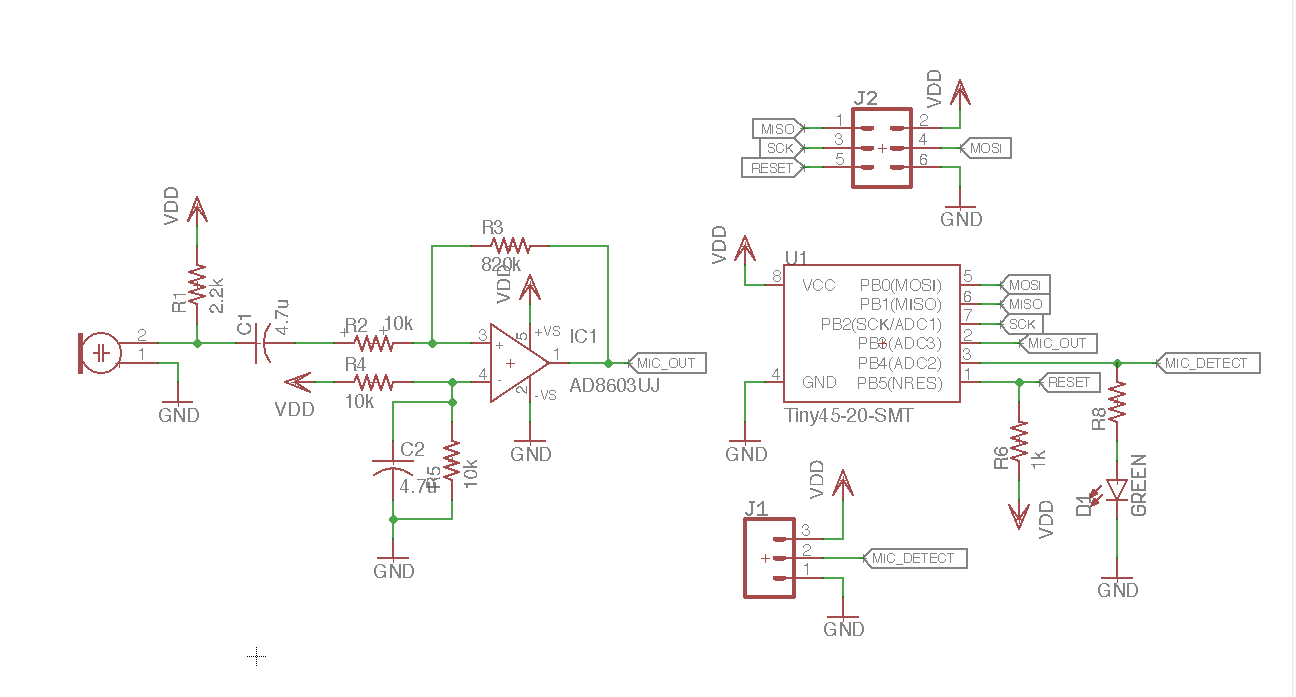
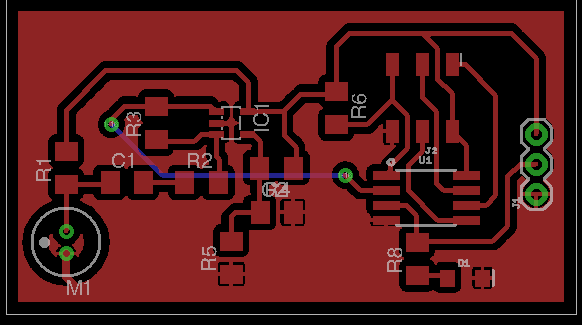
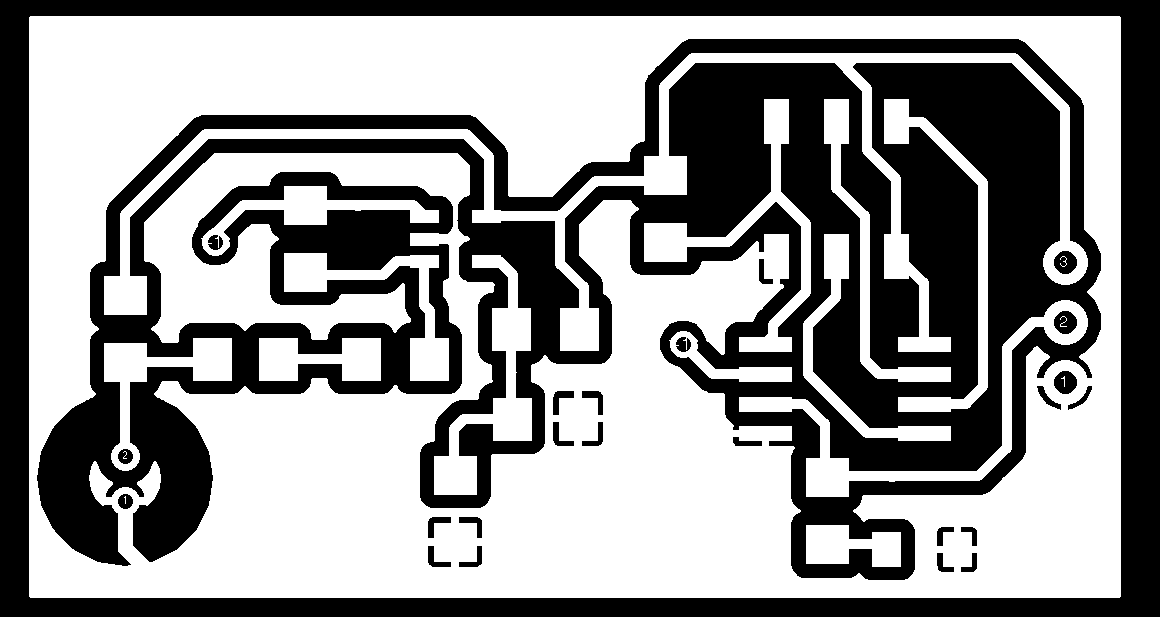
The following images show the Eagle schematic and board design for the Hit Detector, as well as the image for the Fab Module file generator
Microphone board
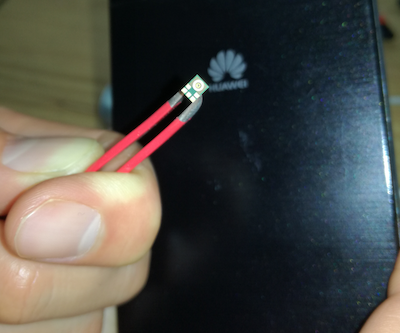
First I needed to find the pinout of the microphone I’m using. This is the I2S Output Digital Microphone. As you can see (below), it is incredibly tiny! It therefore needs to be soldered onto a board.
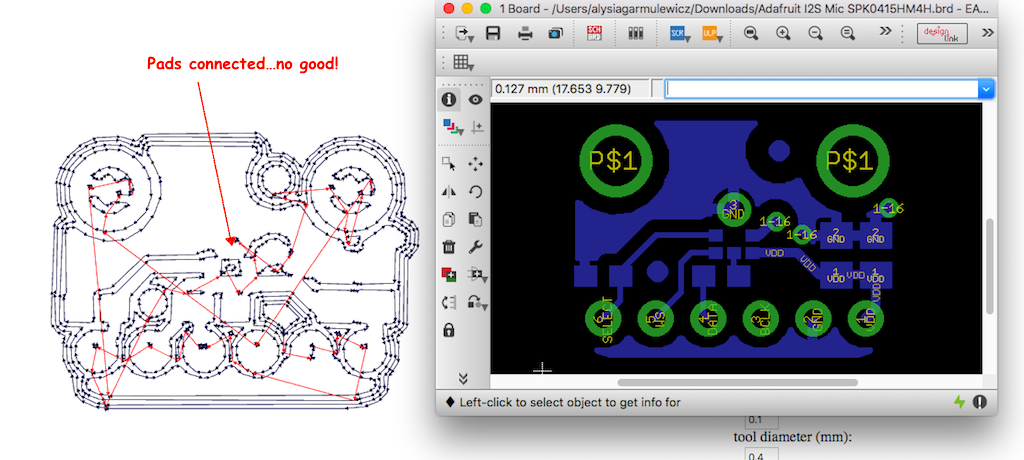
The microphone I ordered comes with a very detailed instruction manual for integrating it with the Adafruit feather board. Everything seemed perfect with the board design and schematic, but when it came to loading it into the fab modules for generating the milling files, we couldn’t get the routing to do it correctly, even when we enlarged the isolations large amount.
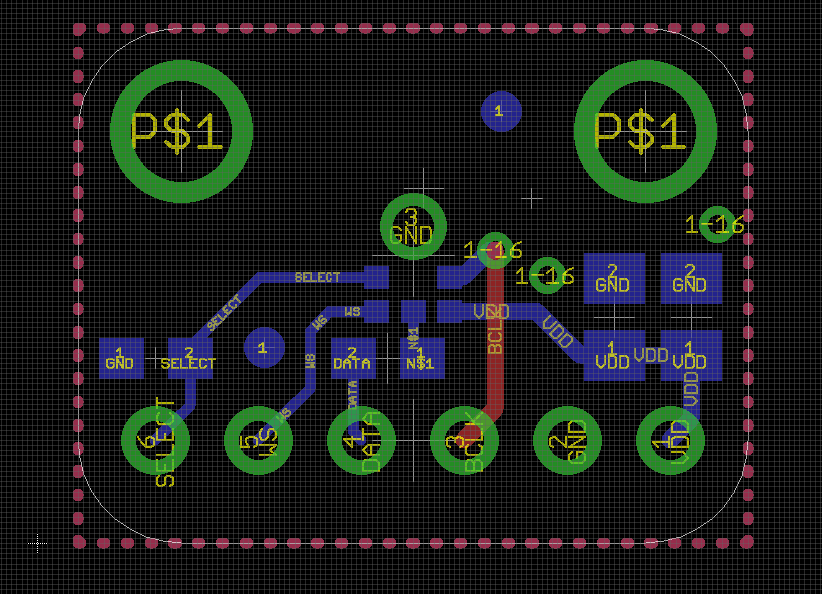
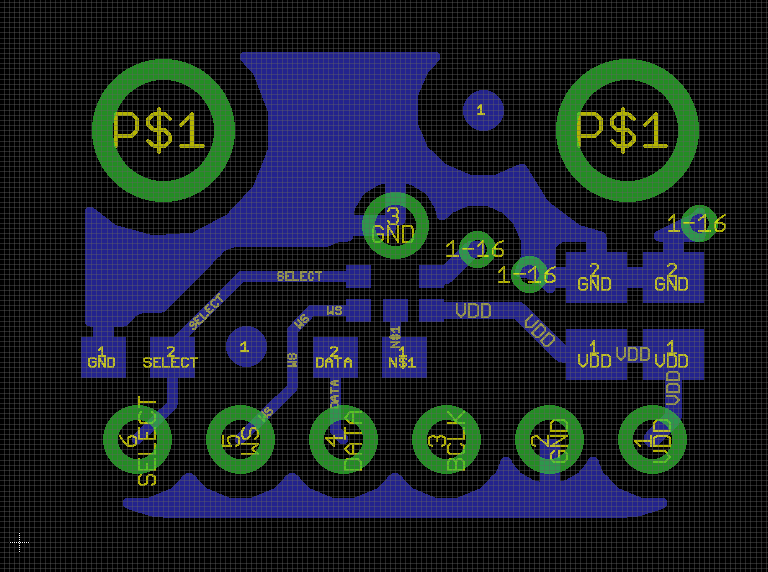
I needed to make my own board design for the microphone. Below are the Eagle schematic and design for the mic board
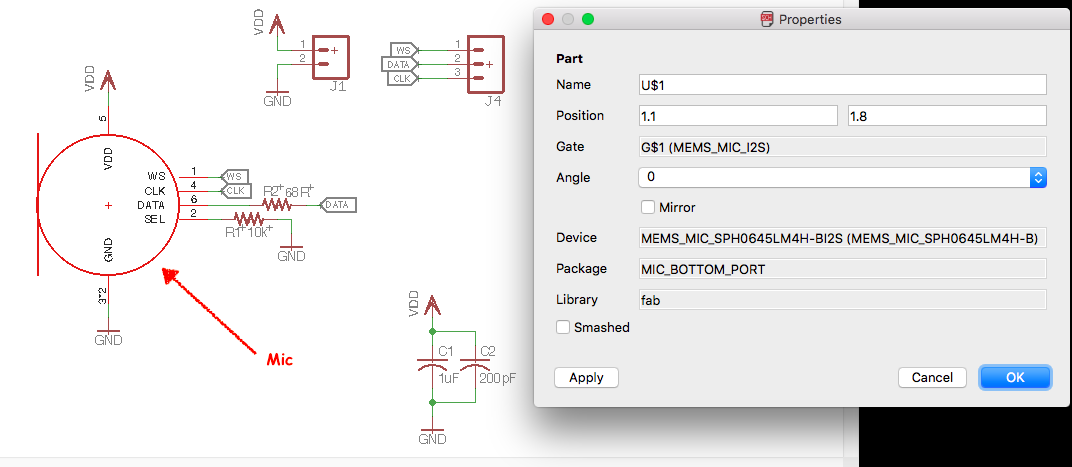
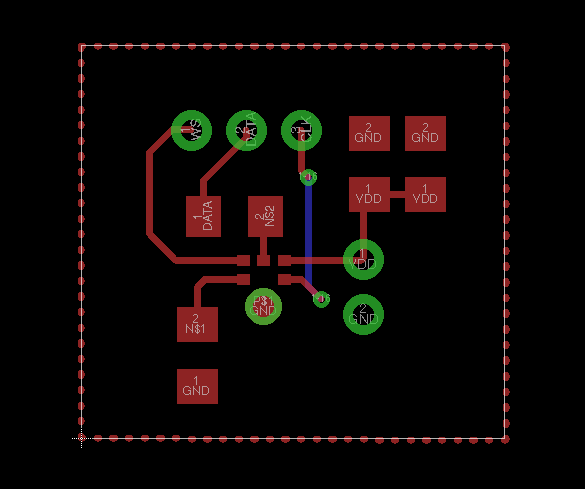
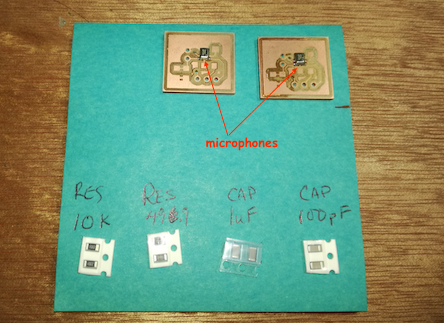
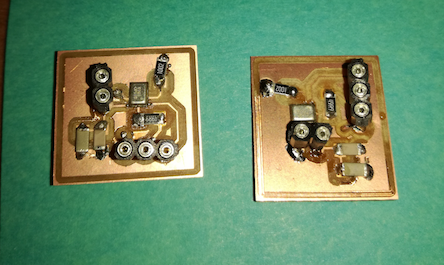
I fabricated 2 microphone boards in order to have a backup in case one didn't work. This ended up being crucial, as one microphone didn't function properly. The components and their assembly are shown below.
PCB Ada fruit Feather board
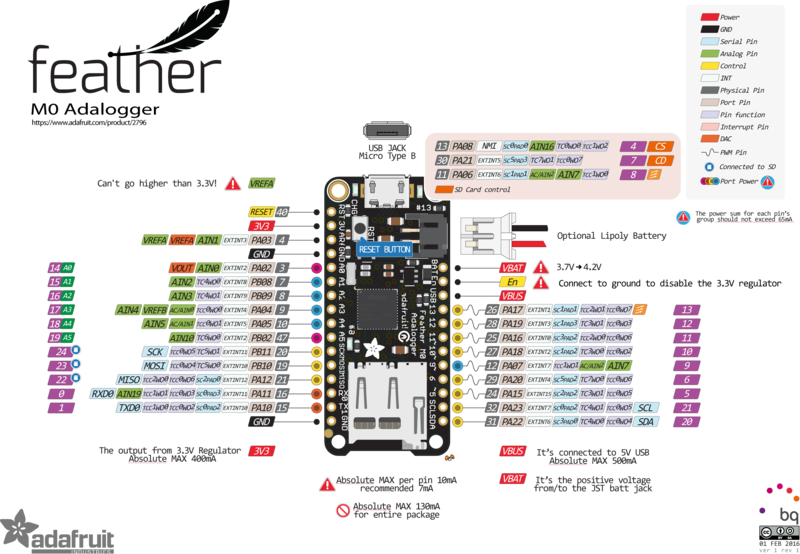
For the microphone data sampling, I decided to use the pcb Adafruit Feather M0 Adalogger. There is excellent documentation with it, and it has the following main components: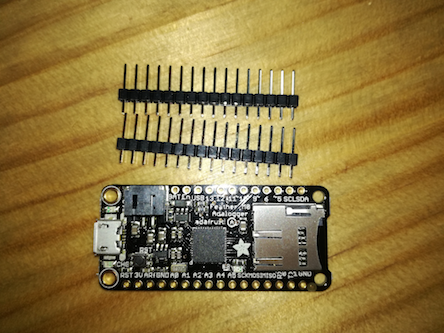
Here are the general components parts of the board
Understanding the board design
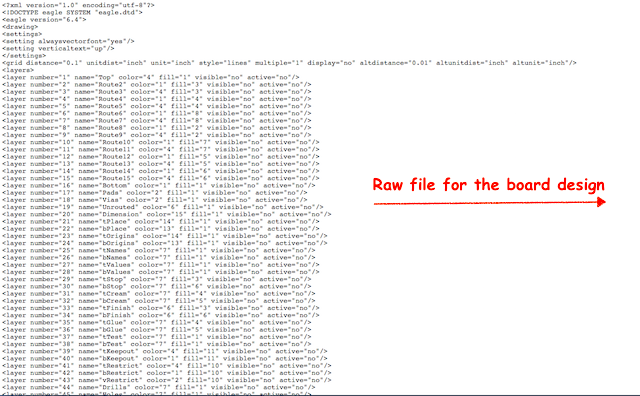
To understand the real design and workings of the board, I found the raw files, saved them as “all file types”, and then Eagle could find them and load them in. This was instructive, because as a raw text files brd and sch on GitHub, you can see the information that the board design stems from.
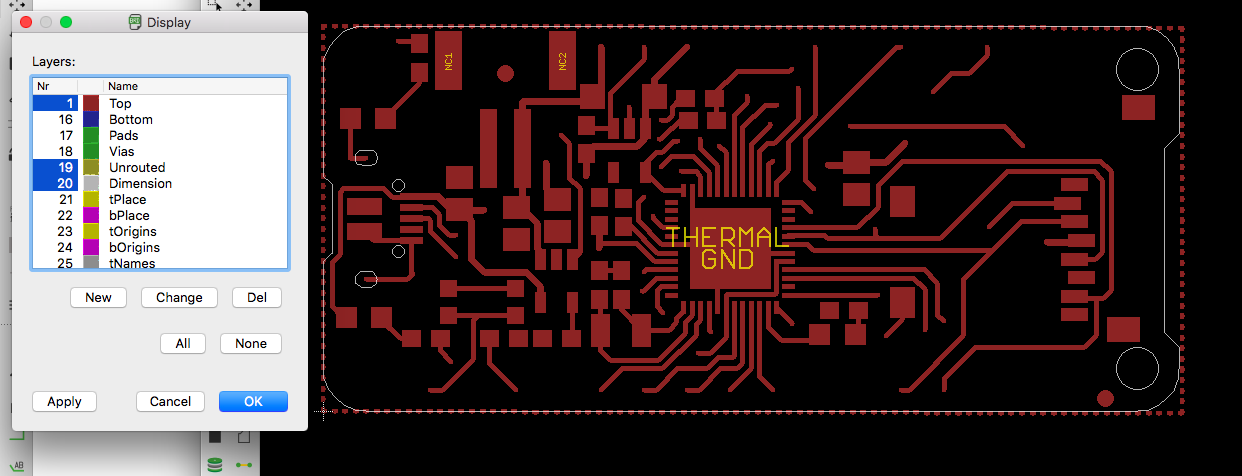
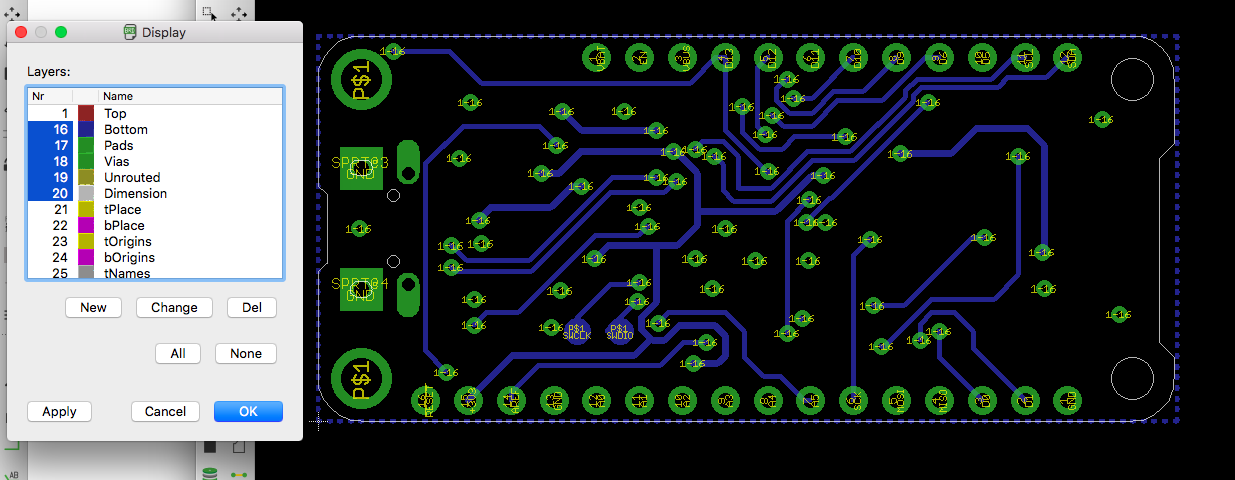
Images raw files linked to board and schematic fileIn Eagle, I played with visualizing the different layers of board design, viewing only the top routes, then changing the layer to view the bottom routes together with the ‘vias’ where the top and bottom connect. Although I hadn’t made this complicated a board from scratch, I could easily see the steps I would take to do so from the other boards I’ve designed and fabricated throughout the course. This is the power of using open source boards…you truly can get under the skin of their design and understand it, layer by layer.
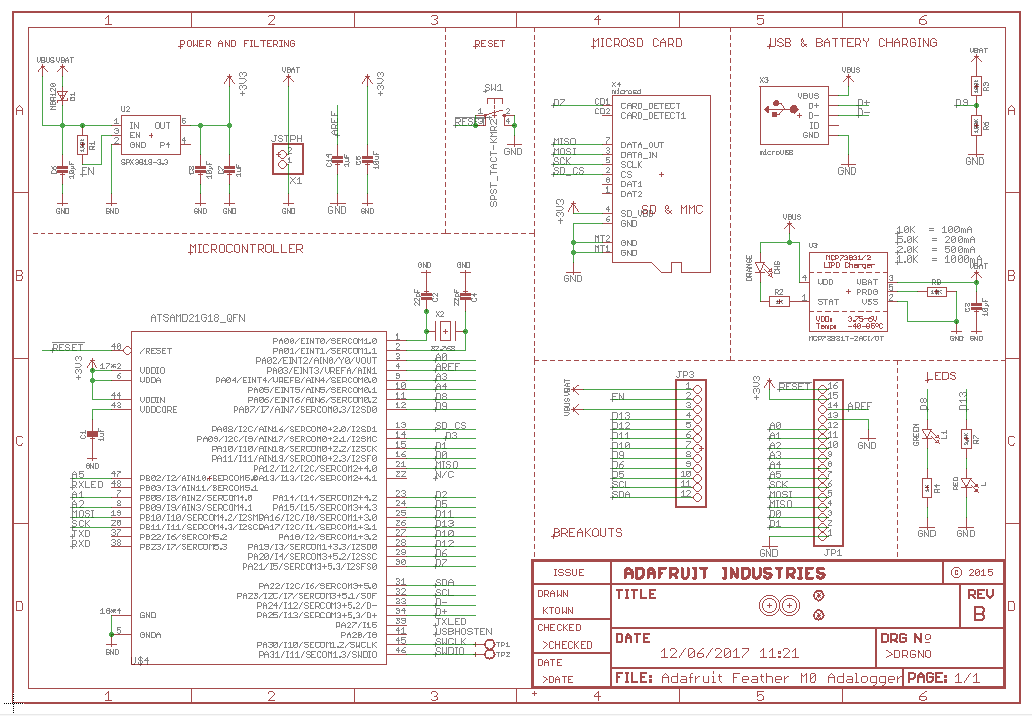
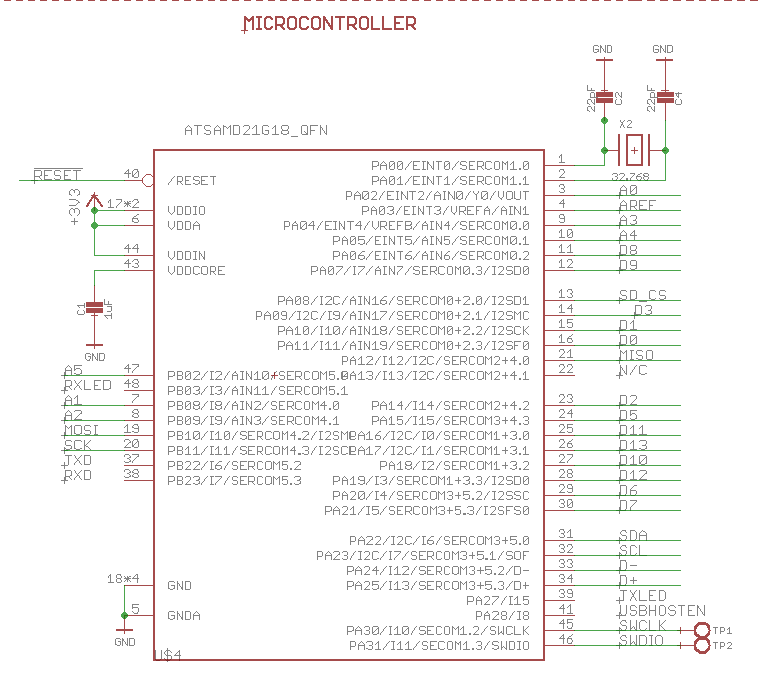
Then I switched to the schematic and looked at the the pinout of the microcontroller. This can be compared with the pinout given in the board instructions.
Programming
I had to program each of the 3 pcbs in the system.
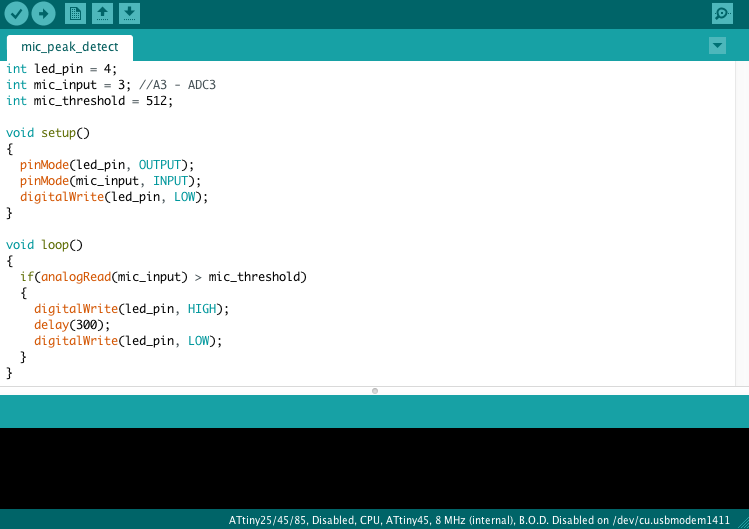
Hit Detector Program
First, the Hit Detector needed to be programmed so that it sent a pulse to the Microphone Board when it registered a sound above a certain threshold. The following image shows the code used.
Adafruit Board Program
This is the library I used for programming the adafruit microprocessor to read the frequency data coming from the microphone and sampling it, sending on a serial amplitude to the python application. The program is designed for the I2S communication protocol that my microphone has. Below is a screenshot of the code.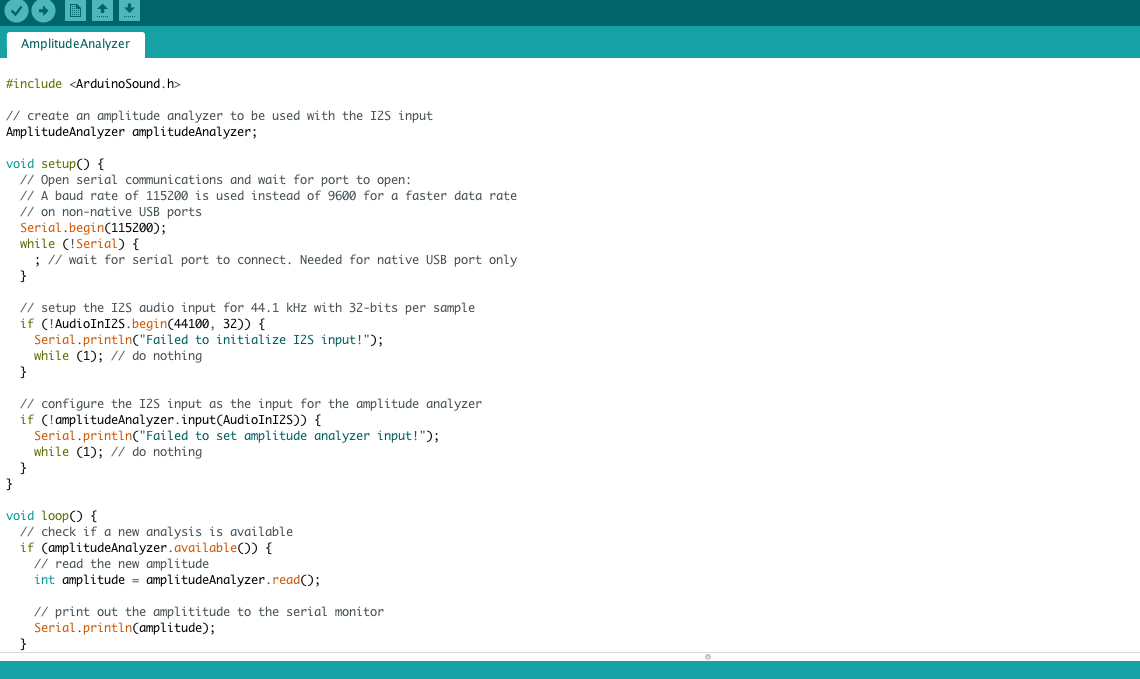
Application
To design and code the application, I needed to create a GUI that included manual user inputs (like the mass of the sample), in addition to a FFT on the incoming amplitude signal sent from the adafruit board (sampled from the microphone board), and a simple equation that computes the elasticity of the sample from the input variables. The following details these components.
Graphical User Interface
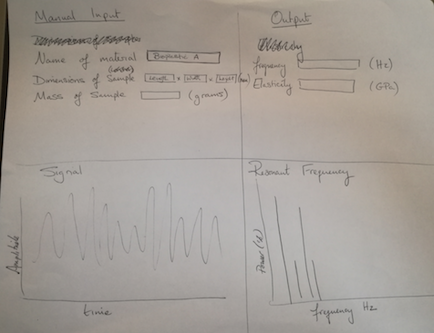
To begin, I listed the main parts of the user interface I wanted:
Here is a picture of the basic application schematic

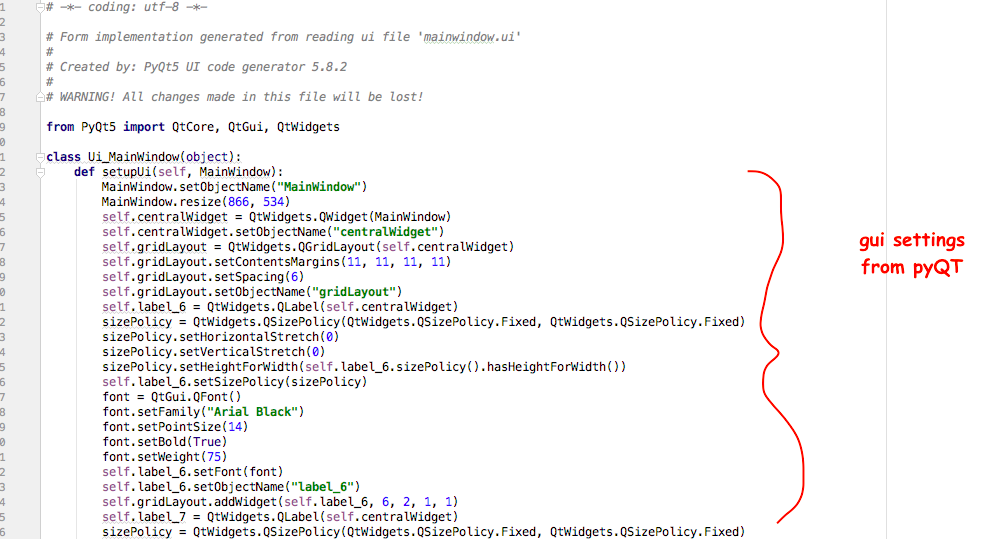
I decided to use PyQT from Homebrew to first develop the application user interface. PyQT is a set of bindings to the QT framework for building applications (a GUI framework and can be binded to many programming languages). I also used the QCustomPlot widgit for PyQT as this allowed me to create plots in my application schematic. Some tutorials are found here
Here is the initial application interface mock up, programmed with pyQT
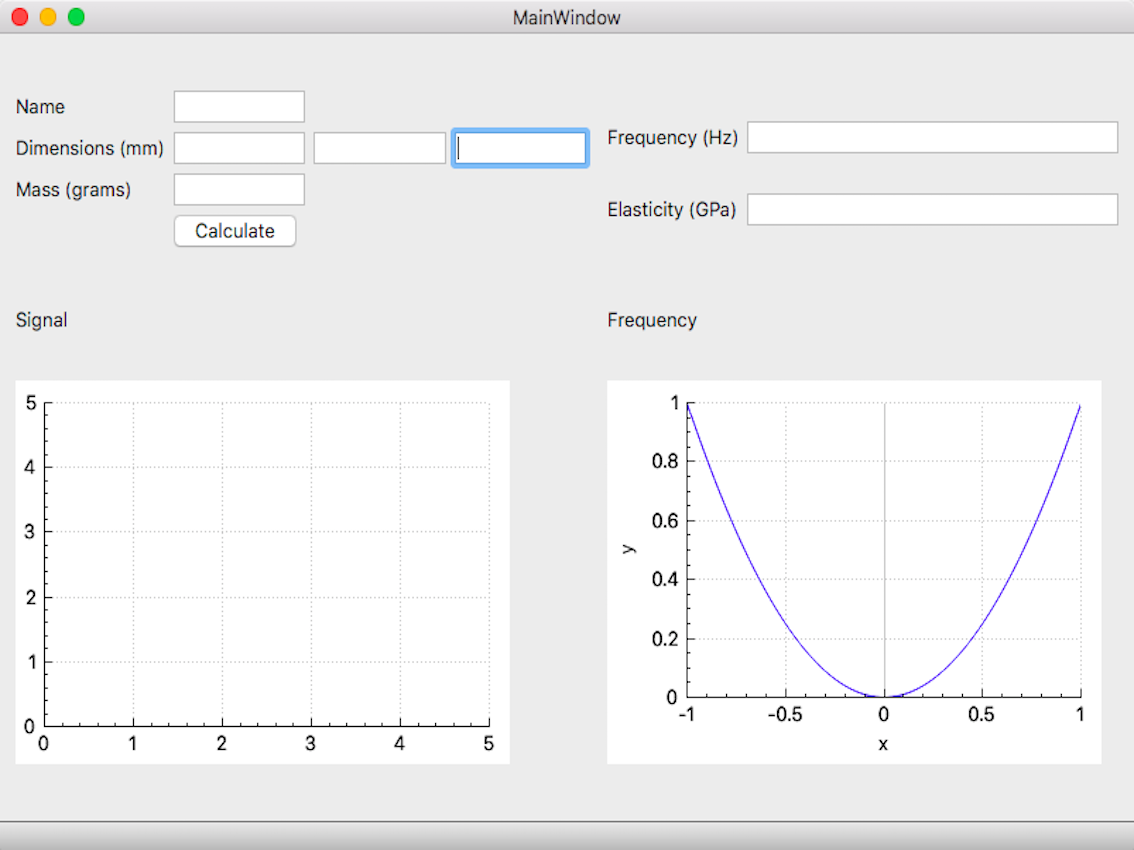
In the final version, this was simplified to show just the frequency and elasticity readouts in number format (see third video below). Integration of a graph format will be done at a later date (forthcoming).
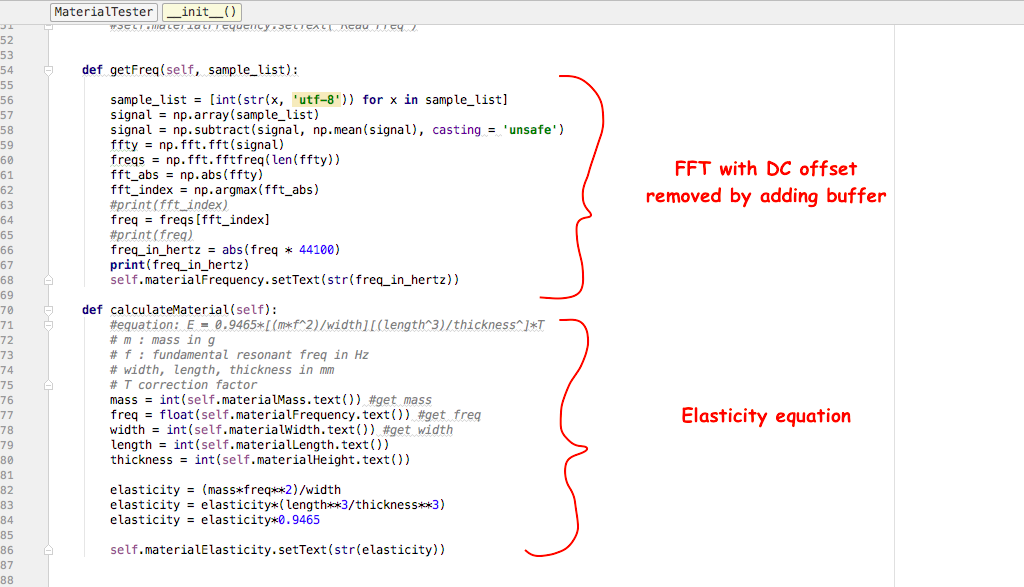
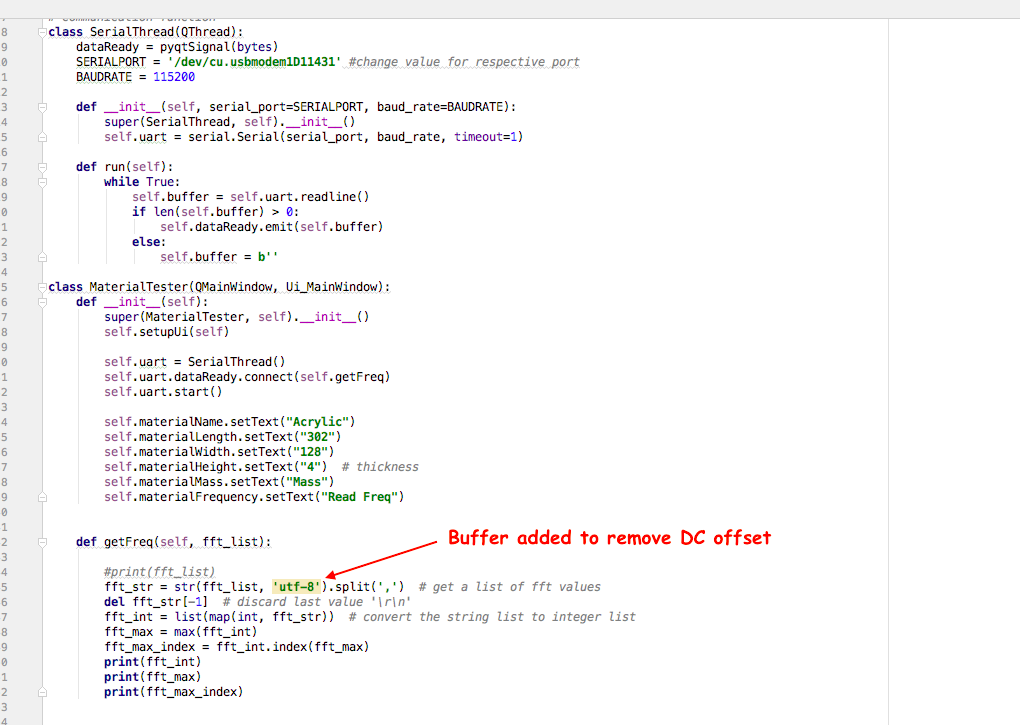
Fast Fourier Transform Component
One of the main issues I found was the need to "remove the DC offset" in the amplitude signal before doing a FFT on the signal. The hit of the mallet on the sample causes a large DC offset, and doing an FFT on the signal without removing it causes a large frequency spike at 0Hz. This is problematic, as it prevents the smaller signal of interest from being registered (in my case, this is the resonant frequency of the vibrating material sample). A very instructive examplation of this can be found here. See below for a screenshot noting this in the code.
Nyquist Limit and the sampling rate
The rate at which the data needed to be sampled was critical to link to the frequency being measured. The 'Nyquist limit' is used as a rule in such situations, stating that the sampling rate should be at least 2 x the frequency wavelength. This is to make sure the frequency is read accurately. If you imagine a sampling rate that is the same rate as a the frequency, you would only read one part of the wave function. Because the vibrational frequency of materials being tested range (in general), from 10-100 Hz, I used 100 Hz as the upper range, and, just to be cautious, made the sample rate 2.5x this rate, giving me 250 as a sample rate. To make it easier computationally, we put the sample rate at 256 (so that it is base 2). See below for a screenshot noting this in the code.
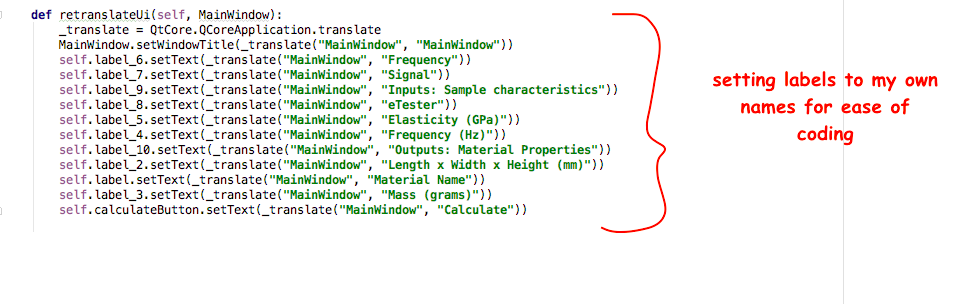
Python coding
I then used PyCharm for my coding. The interface made it easy to understand the notation of python, and to organize and import files.
The following screenshots of the application code serve to explain the various parts noted above.

System Integration
I integrated the components of the electronics system in parts, testing and troubleshooting at each stage. The following is a series of 3 videos that shows the progression of functionality tests. First, I tested whether the microphone board works, and whether the signal can be read with the software libraries using I2S communication. We demonstrated the signal in terms of amplitude as well as running an FFT on it (this is Xavi singing into it!).Second, we tested how the microphone signal output can be analyzed with the python application.
As an intermediate step, here is a demo video before the Hit Detector and proper FFT is integrated into the application. The gui is a simplified interface.
Project demo
The final project demonstration can be found on the Showcase page.
Troubleshooting
First, Upon integration of the whole system there was a problem with the microphone on the fabricated board. The original tests show the mic board working, (see video test above). To get the whole system to work, I used another mic board for the final test. This showed that a more professional microphone wasn't needed to read the frequency acurately. The Hit Detector that was fabbed also acts as an input device with its microphone, so at least there was redundancy built into the system in terms of the final project requirements. Second, upon doing the first tests with the application, a huge number came out as the Elastic modulus. I realized that the standard measure of Giga Pascals, 1,000,000,000 pascals, and the equation in the software was just providing pascals. This was fixed in the code, so that the read out appeared more standard.
The final project demonstration can be found on the Showcase page.
License for eTester
The eTester is registered under a Creative Commons license.Acknowledgements
I'd like to thank Xavier Garcia for his amazing support and guidance. I'd also like to thank Pia Pinedo for insights into the mathematics of vibrational frequencies. I'd like to thank Fab Lab Santiago for their support and fantastic work environment.
Here are the project files: