Exercise 16 Interface and Application Programming
Assignment Requirements
- write an application that interfaces with an input &/or output device that you made,
- comparing as many tool options as possible
Introduction
After fifteen weeks of frequent PCB making/stuffing/soldering/ programming exercises; for this week I will take this opportunity to revisit on the thermistor board I made in Exercise week 13.
To begin with, I started with what I don't have chance to complete on week 13. This time round I started with using IDE instead of Atmel Studioto burn loader and upload the original programme again. Voila! Everything work fine.
The programme codes being use can be downloaded here.Essentially, tempsensor.ino is actually the original hello.temp.45.c file but running in IDE.
The success certainly have boost my confidence. So I proceed to make reference to my senior page as well as our local instructor previous year pages to seek a way that I can follow to learn and write an application that interfaces with my input device - thermistor board.
Working With Python and Tkinter
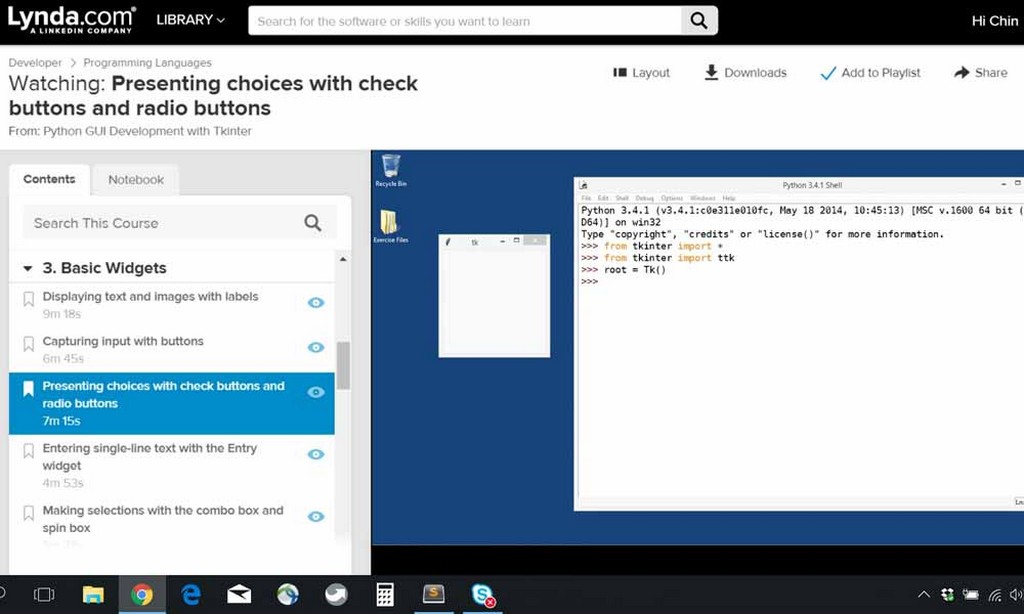
Tkinter: Referencing one of my senior past year work on Tkinter, I saved a little bit of time by watching of the same Lydia tutorial entitled "Python GUI Development with Tkinter" on Thursday and Friday. With reference those past documentation and little read up on youtube and google I am able to continue to use my Python 2.7 installation and dived directly into the related topic on buttons creation with some minor syntax changes in python.
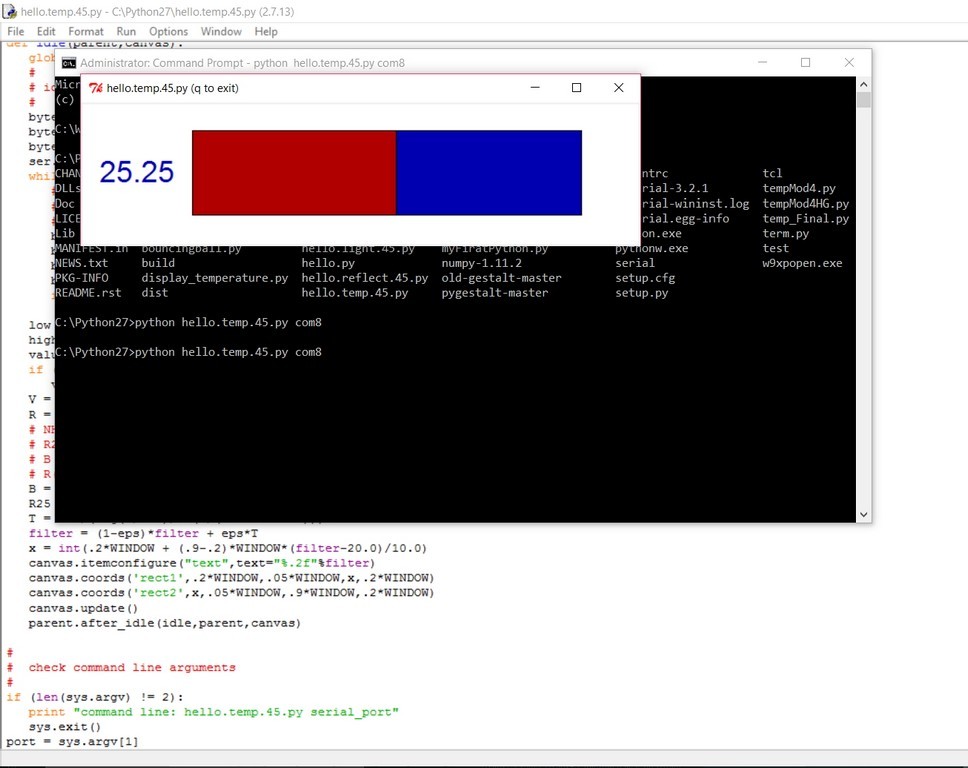
As my senior code was written using python 3.4, I spent some time to modify the code (which was modified from the python codes in class page that display temperature on a GUI bar. I was using IDLE as the platform for modifying the codes.
Some of the modification are listed as follow:
  from Tkinter import *    // in Python 2, use capital T for Tkinter
  from numpy import log
  import ttk                      // in Python3 , use from tkinter import ttk
  import serial
2 variables were added to hold celcius and Fahrenheit values, and a function called to the radio button selection. The variables are as follow:
   ctemp = filter
   ftemp = (ctemp*9.0)/5.0+32  # Celcius to Fahrenheit
   display_temp()
def display_temp():
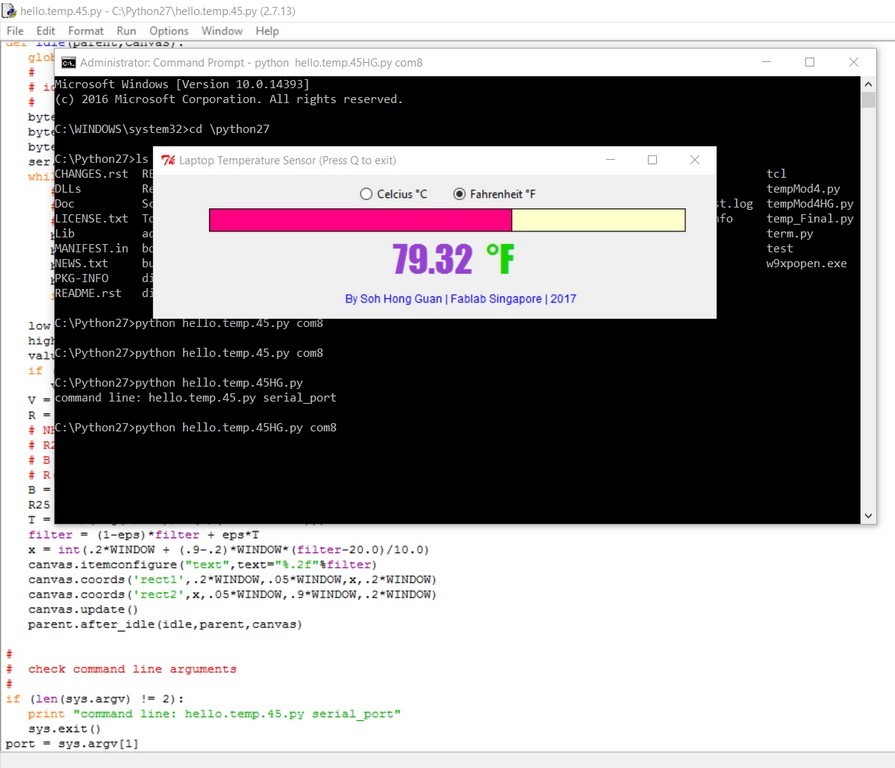
if rbVar.get() == 2: # display Fahrenheit
text2 = "°F"
canvas.itemconfigure("text2",text="%s"%text2)
canvas.itemconfigure("text",text="%.2f"%ftemp)
else: # display Celcius
text2 = "°C"
canvas.itemconfigure("text2",text="%s"%text2)
canvas.itemconfigure("text",text="%.2f"%ctemp)
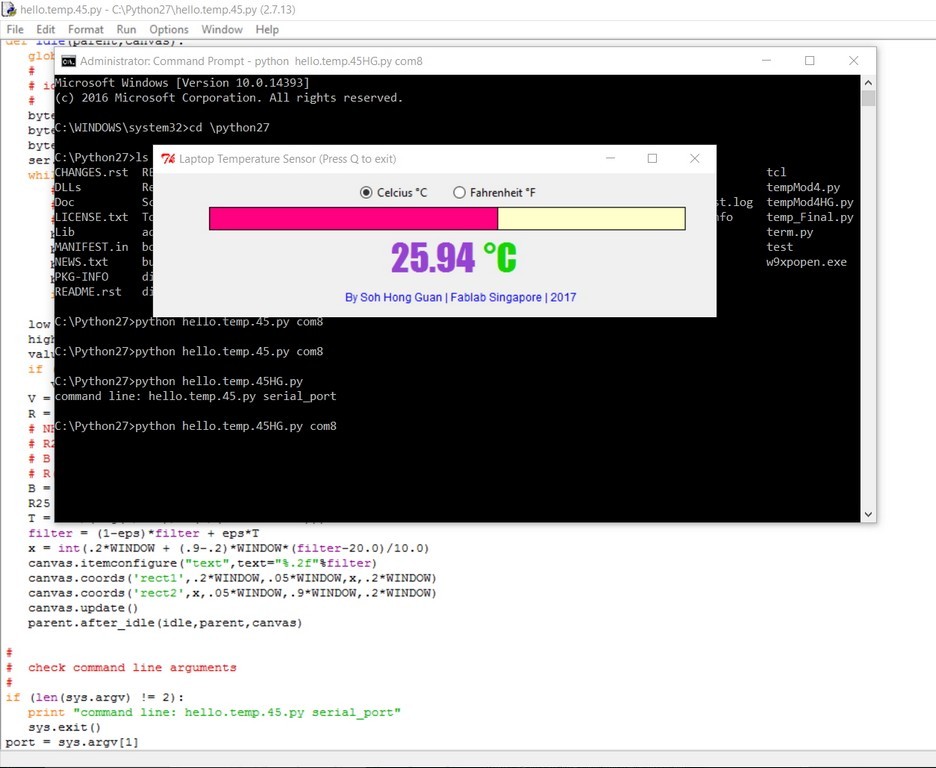
With the following codes to include two radio buttons on the canvas
    rb1 = ttk.Radiobutton(root, text='Celcius °C ', variable=rbVar, value=1, command=display_temp).place(x=220,y=10)
    rb2 = ttk.Radiobutton(root, text='Fahrenheit °F', variable=rbVar, value=2, command=display_temp).place(x=320,y=10)
From there I also did some minor alteration of the code to change the colors and of the displays and the result are as recoded in the following screen captures and video:
My modified programme codes being use can be downloaded as shown below:
Essentially, the .ino file I used back the same original hello.temp.45.c file but only modified the python code for graphical display effect. A video clip is captured as illustrated below:
Verification of temperature measure with arduino code and pyhton programming.
After the success of this conversion application GUI, I begun to question whether the temperature measured and displayed on the bar were accurate.The reading seem to be clipped at between 20 C ~ 30 C. I was not able to alter the Steinhart Equation to measure temperature range higher than 30 C.
As such I uploaded the arduino programme documented in my
week13 exercise.- section of study on thermistor.Another python programming application GUI to display the room temperature reading is as shown:
    # -*- coding: utf-8 -*-

	from serial import *
    from Tkinter import *
    WINDOW = 500 # window size
    BG='white' #Default BG color
    serialPort = "COM8" #my PC is using COM7
    baudRate = 9600
    ser = Serial(serialPort , baudRate, timeout=0, writeTimeout=0) #ensure non-blocking

    #make a TkInter Window
    root = Tk()
    root.wm_title("Reading Temperature")

    canvas =Canvas(root, width=WINDOW, height=.25*WINDOW, background=BG) #Set the Canvas
    canvas.create_text(.1*WINDOW,.05*WINDOW,text="Cool ",font=("Helvetica", 24),tags="status",fill="#0000b0") #Set the Status Temperature
    canvas.create_text(.3*WINDOW,.155*WINDOW,text=".33",font=("Helvetica", 24),tags="text",fill="#0000b0") #Set the Temperature number
    canvas.create_text(.4*WINDOW,.125*WINDOW,text="°C",font=("Helvetica", 24),tags="DC",fill="#0000b0") #Set the °C
    canvas.create_oval(220, 50,270, 100, width=2, fill='white', tags="oval")
    canvas.pack()

    #make our own buffer
    #useful for parsing commands
    #Serial.readline seems unreliable at times too
    serBuffer = ""

    def readSerial():
        while True:
         c = ser.read() # attempt to read a character from Serial

    #was anything read?
        if len(c) == 0:
            break

        # get the buffer from outside of this function
        global serBuffer

        # check if character is a delimeter
        if c == '\r':
            c = '' # don't want returns. chuck it

        if c == '\n':
            serBuffer += "\n" # add the newline to the buffer

            #add the line to the TOP of the log
            #log.insert('0.0', serBuffer)
            #print serBuffer
            canvas.itemconfigure("text",text=serBuffer)
            if serBuffer <= '28':
                canvas.itemconfig("status", text="Cool") # change text
                canvas.itemconfig("oval", fill="blue") # change color

            elif serBuffer > '28' and serBuffer <= '30':
                canvas.itemconfig("status", text="Warm") # change text
                canvas.itemconfig("oval", fill="yellow") # change color
            else:
                canvas.itemconfig("status", text="Hot!") # change text
                canvas.itemconfig("oval", fill="red") # change color

            serBuffer = "" # empty the buffer
        else:
            serBuffer += c # add to the buffer

    root.after(10, readSerial) # check serial again soon


   # after initializing serial, an arduino may need a bit of time to reset
    root.after(100, readSerial)
    root.mainloop()
A copy of the python program and arduino .ino file for temperature measurement verification can be downloaded as follow:
The temperature reading recorded with the colour representation are as shown:

A video capture of the tempature reading is a shown.
Working with matplotlib in python2.7
matplotlib: I used another half a day trying to understand matplotlib and how to plot a graph from live data. The website and youtube tutorial by Paul McWhorter has been most helpful to explain some of the concepts and purposes behind the syntaxes of matplotlib.
matplotlib is a python 2D plotting library which produces publication quality figures in a variety of hardcopy formats and interactive environments across platforms. To install matplotlib, I will execute "pip install matplotlib" at command prompt. I will also need drawnow, which can be installed by executing "pip install drawnow" at command prompt.
The codes are as follows:
from Tkinter import *
from numpy import log
import ttk
import serial
import matplotlib.pyplot as plt #import matplotlib Library
from drawnow import *
#plt.ion() # interactive mode to plot live data
tempV=[]
filter = 0.0
eps = 0.5
cnt = 0
SerialData = serial.Serial('COM8',9600)
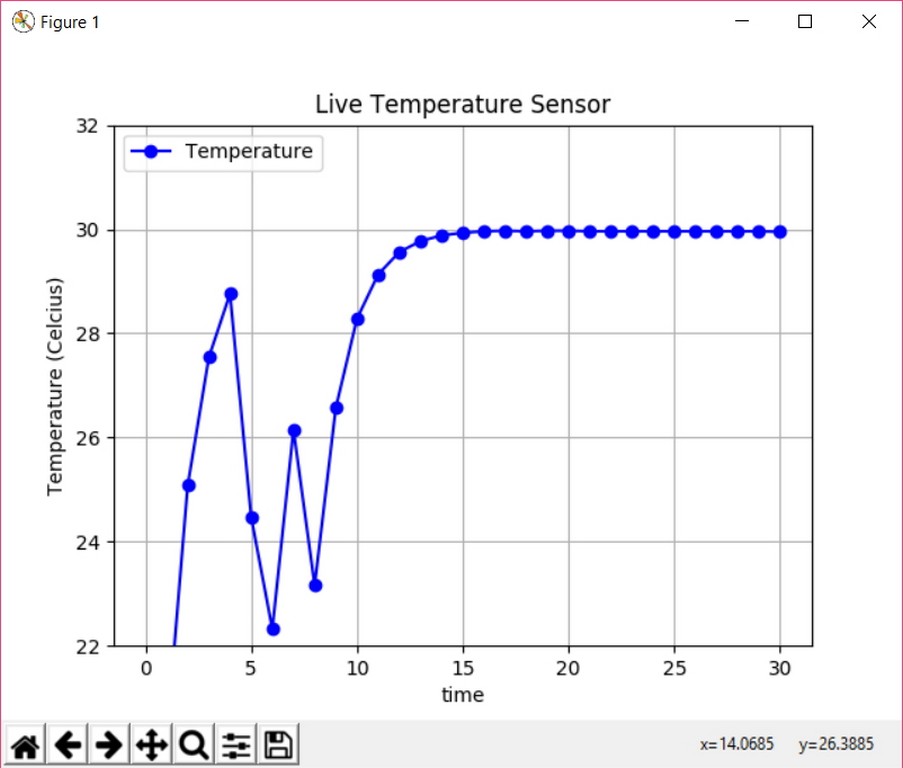
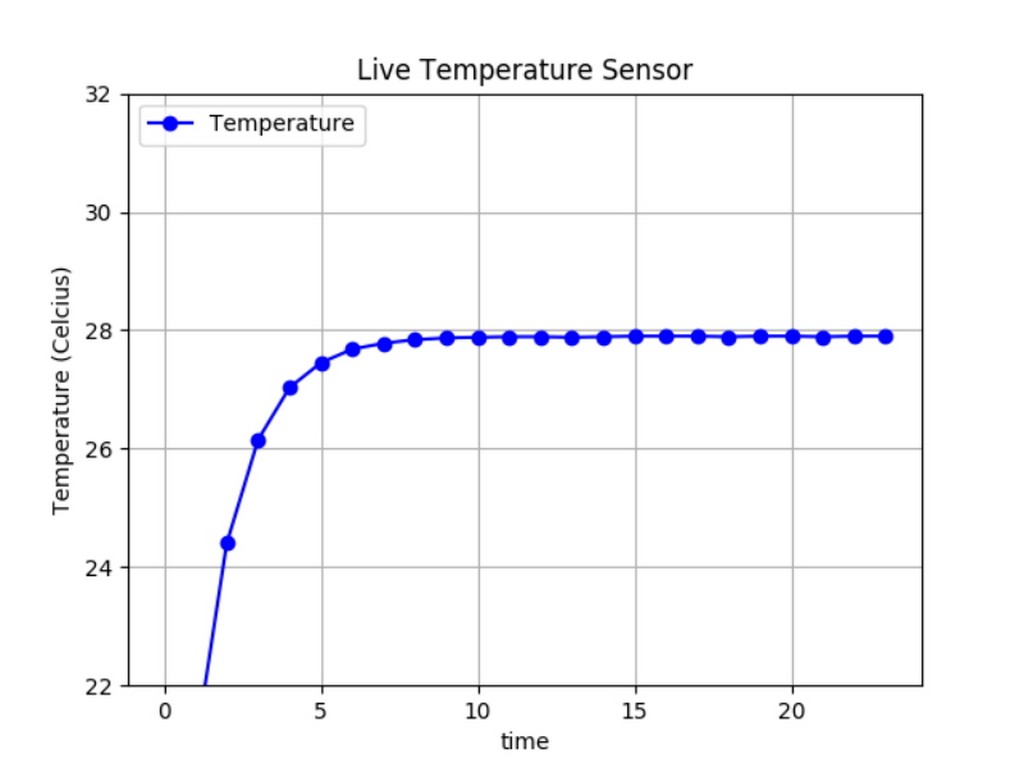
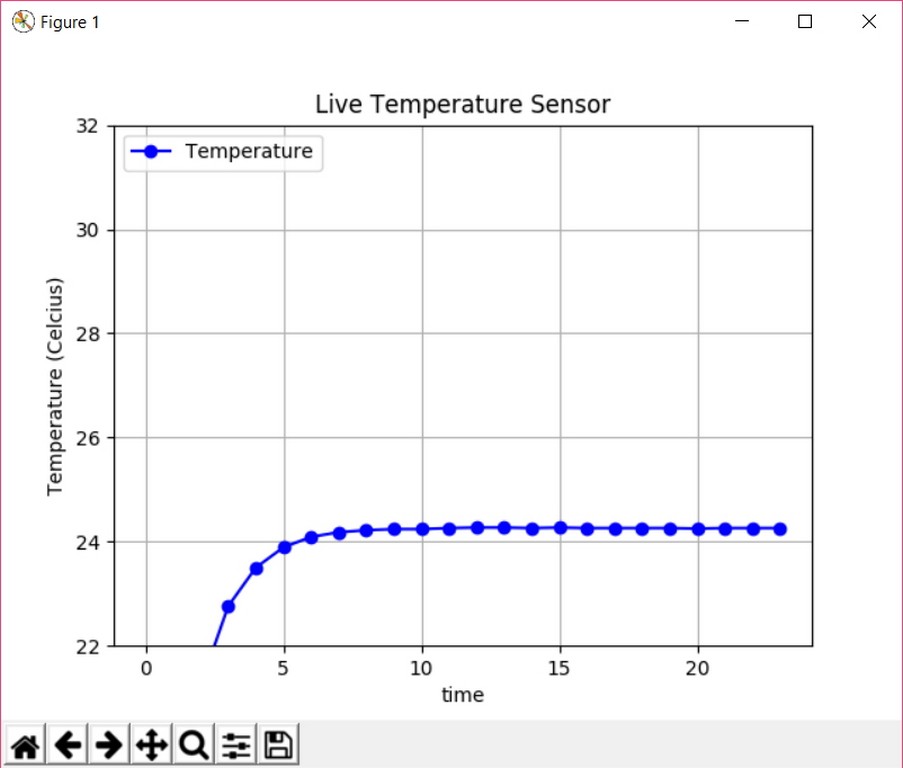
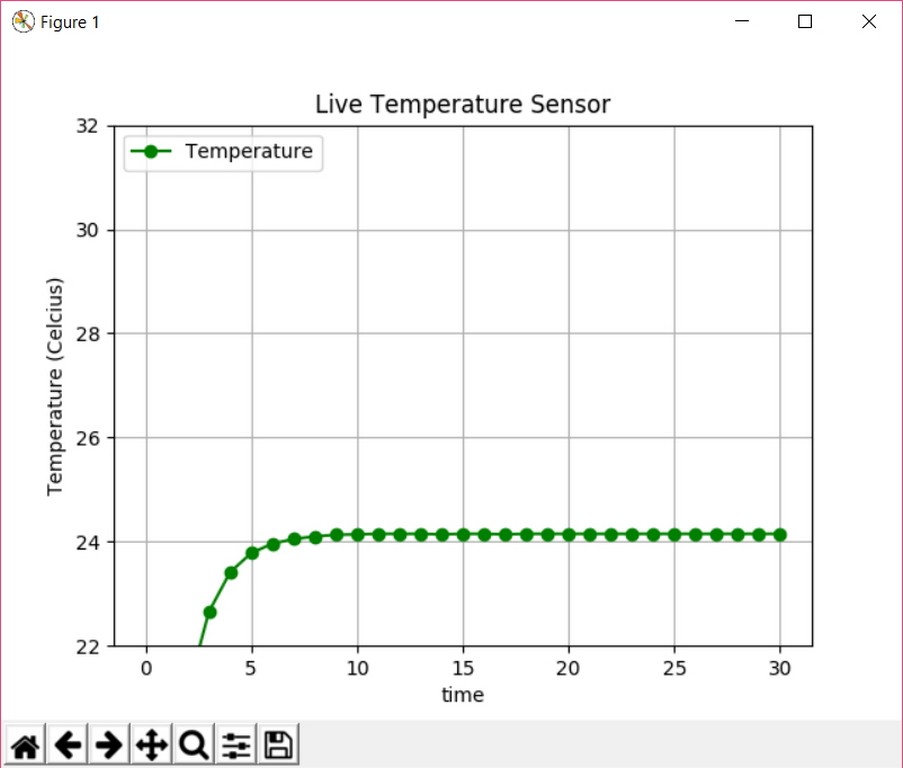
def makeGraph(): # a function that makes desire plot
plt.ylim(22,32) # y axis limiter
plt.title('Live Temperature Sensor')
plt.grid(True)
plt.ylabel('Temperature (Celcius)')
plt.xlabel('time')
plt.plot(tempV, "bo-", label='Temperature') # blue round dot
plt.legend(loc='upper left')
while True:
byte2 = 0
byte3 = 0
byte4 = 0
SerialData.flush()
while 1:
#
# find framing
#
byte1 = byte2
byte2 = byte3
byte3 = byte4
byte4 = ord(SerialData.read())
if ((byte1 == 1) & (byte2 == 2) & (byte3 == 3) & (byte4 == 4)):
break
low = ord(SerialData.read())
high = ord(SerialData.read())
print(low)
print(high)
value = 256*high + low
if (value > 511):
value -= 1024 # value = value - 1024
V = 2.5 - value*5.0/(20.0*512.0) # Voltage out (Vo) = R / (R + 10K) * Vcc = 2.5
R = 10000.0/(5.0/V-1.0)
B = 3630.0
R25 = 10000.0
T = 1.0/(log(R/R25)/B+(1/(25.0+273.15))) - 273.15
filter = (1-eps)*filter + eps*T
temp = float(filter)
tempV.append("%.2f" % temp) # Build our array by appending temperature readings
print("%.2f" % temp)
drawnow(makeGraph) # call drawnow to draw live graph
plt.pause (.0001)
cnt=cnt+1
if(cnt>30): # delete the first item from the array
tempV.pop(0) # this allows us to just see the last 30 data points
A copy of the python program that used for the matplot and temperature sensing ino file are as follow:
Observations and further study
Reflections
This week's assignment had given me another chance to revisit the thermistor sensor board experiment with python code GUI that I could not get any response on the serial communication through FTDI on Exercise 13. It was fun exploring new languages and greatly satisfying when the programme was able to perform in the way I wanted it to. I wish I could have spend some time to look into yet another sensor input board that I made - Phototransistor board when time permit. But really, at week16 we are really running out of time and should be getting our Final Project ready. Therefore, I would have to just satisfied with the thermistor input sensor board study.
References
- PYTHON GUI PROGRAMMING TKINTER
- Python and Tkinter Programming by John E. Grayson
- An Introduction to Tkinter by David Beazley
- Tkinter 8.5 reference: aGUI for Python by John W. Shipman
- Tkinter – GUIs in Python
- TCK TK
- An introduction to GUI programming with Tkinter by Erik Spence
- Python with Arduino LESSON 11: Plotting and Graphing Live Data from Arduino with Matplotlib
- NTC Thermistors (Data sheet)
- Using a Thermistor
- What Is An NTC Thermistor
- Temperature Measurements with Thermistors: How-To Guide
- NTC Type SMD by Erik Spence
- An introduction to GUI programming with Tkinter
- Kelvin to Celsius formula