

Week 16
Week 16
Interface and Application Programming
Assignment:
Write an application thatinterfaces with an input or output device that you made, comparing as many tool options as possible.
I decided this week to work with my input device from week 13 the termerature sensor. I really enjoyed the programming involved with this project so I wanted to see what I could do with the application and the python file. Since I am a colors person (Art) this was mostly interesting to me!
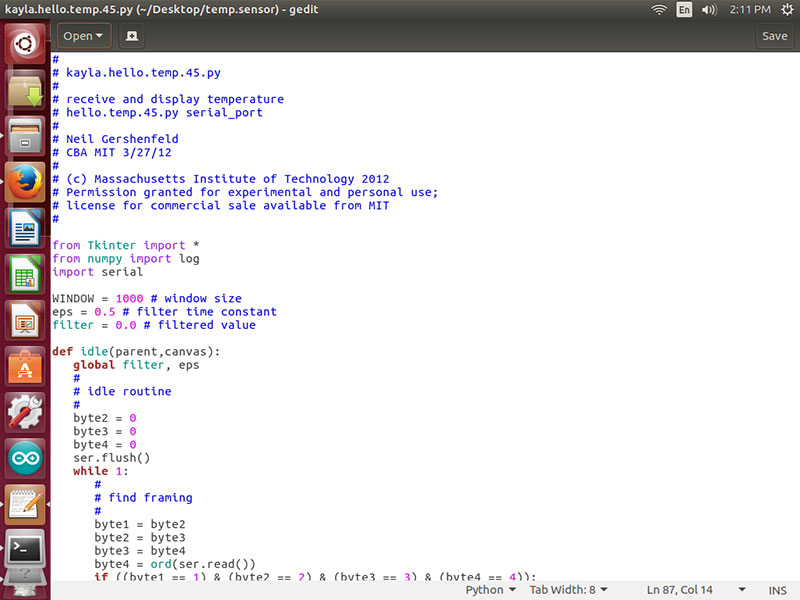
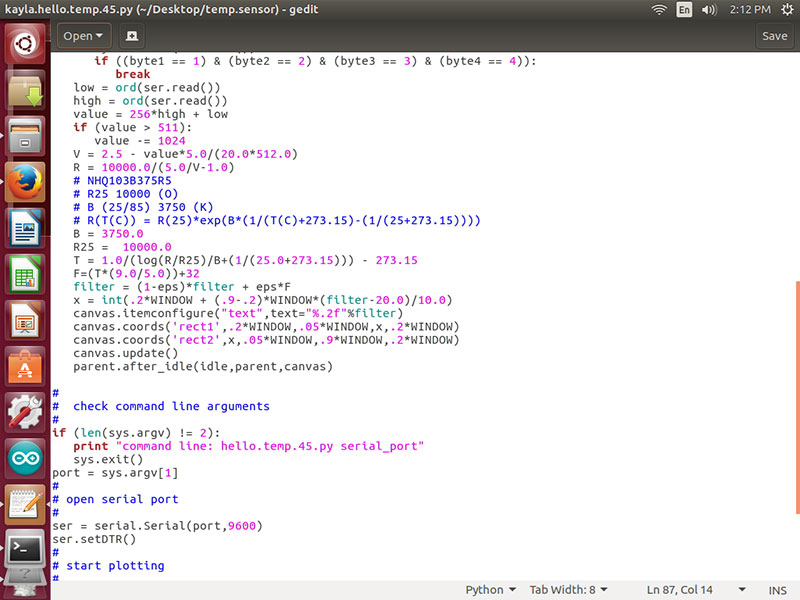
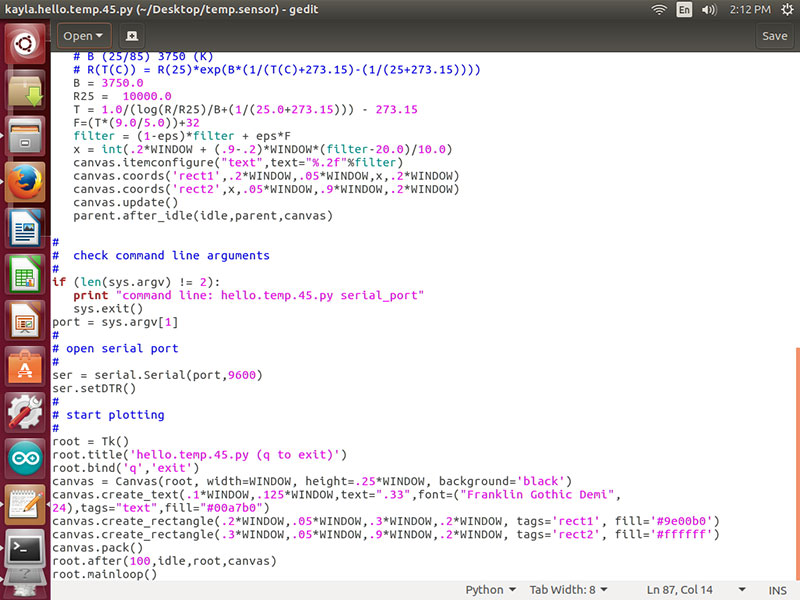
I started by opening the file hello.temp.45.py from my temperature sensor and started reading line by line to see if I could figure out what changes I wanted to make. As you can see below I made changes in green, crossing out the old and adding the new.
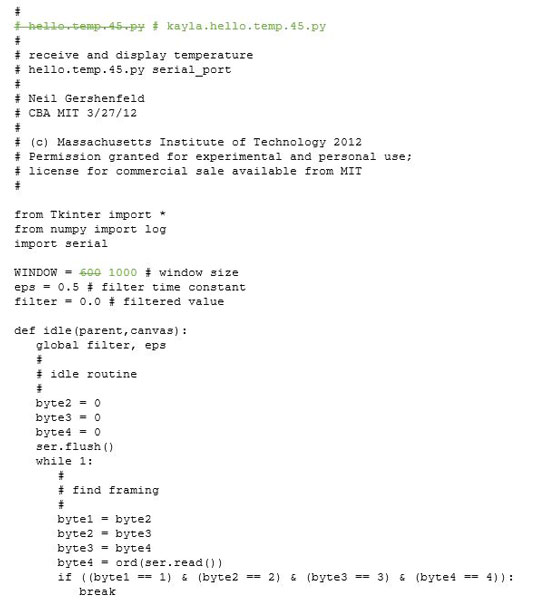
When originally creating the input device I wanted to see what the temperature was in fahrenheit not celsius, so I did a little research and found that there was a way that you could insert in equation into the py file to change the way that the application read the input (temperature). I used the line F=(T*(9.0/5.0))+32 -Aparently if you only use 9 and 5 py will not read them as the numbers needed.
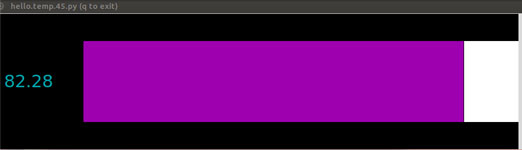
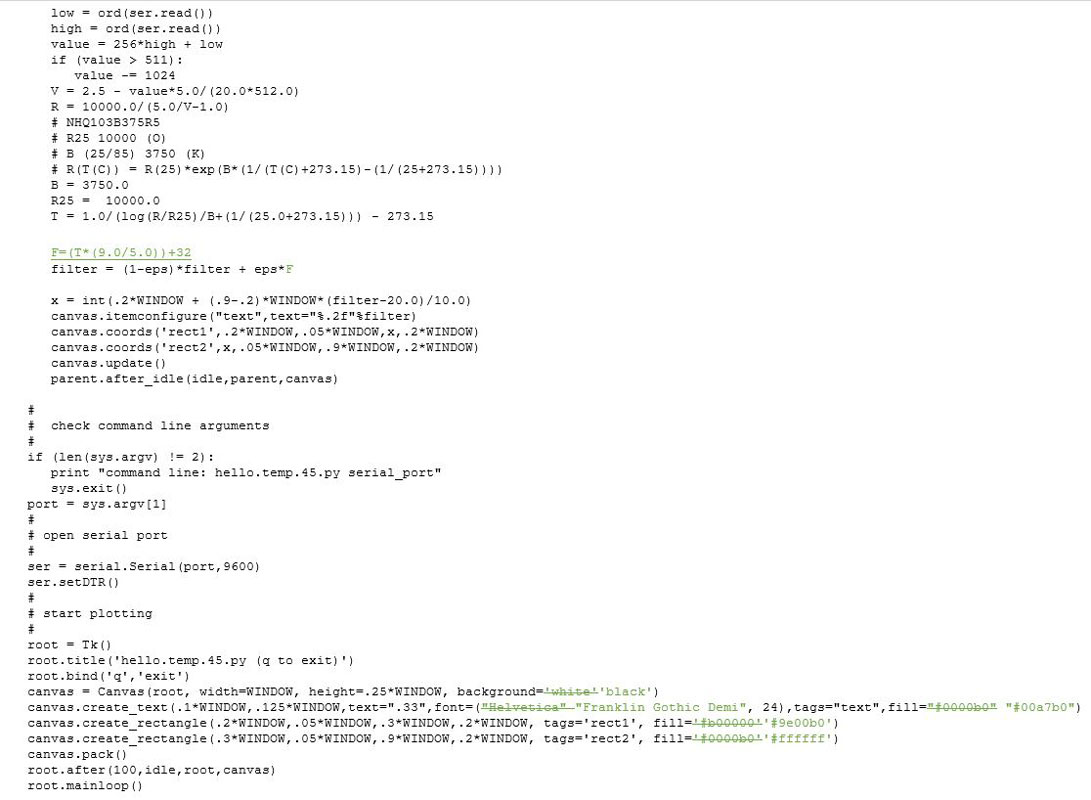
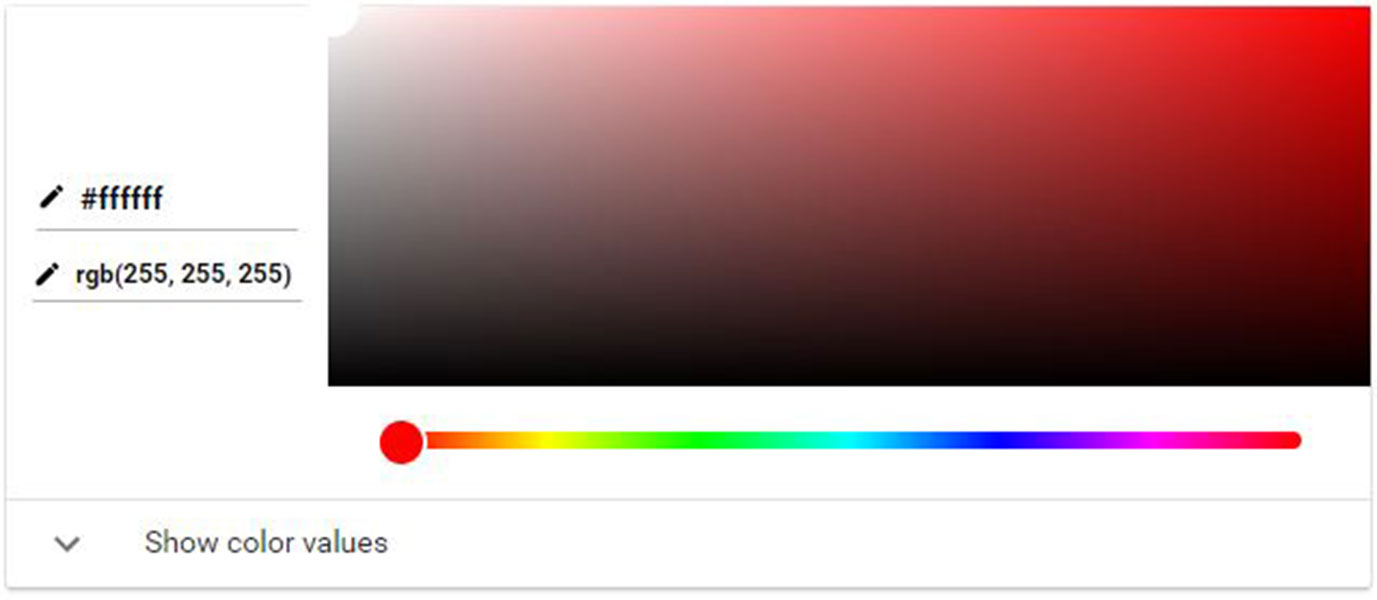
I also changed the background color to black, the window text to Franklin Gothic Demi, the text color to teal and the sensor colors to purple and white. I have also changed the size of the window to 1000 from 600. Below you can see my file in gedit and also the color picker I used to help find the colors I wanted to use.
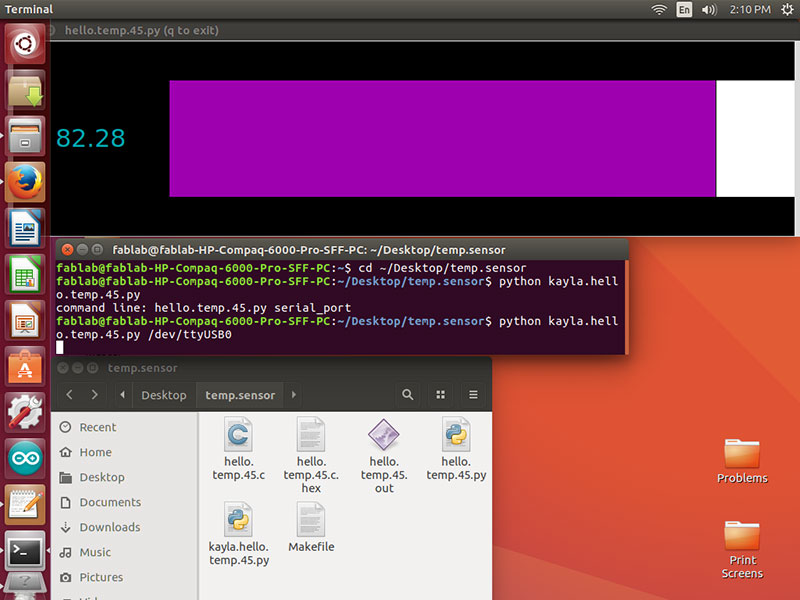
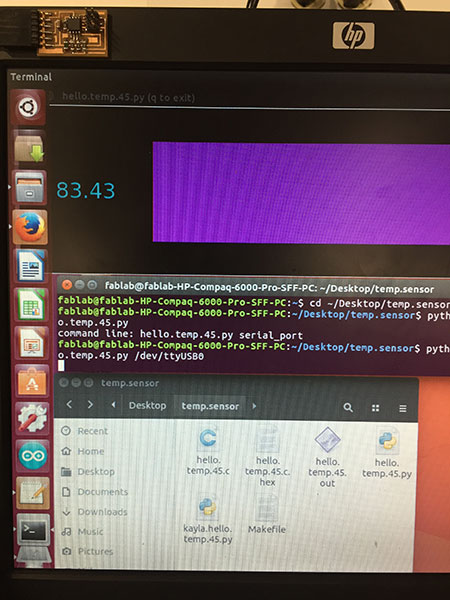
After setting up my temperature sensor to the FTDI cable which I also plugged in, I then went to the termial on my linux machine and cd'd into the temp.senso folder on my desktop: cd ~/Desktop/temp.sensor
Then: kayla.hello.temp.45.py
The terminal responded that I needed to itentify my serial port for the FTDI cable. I looked back at my notes from the previous week 13 and then entered: kayla.hello.temp.45.py /dev/tty/USB0
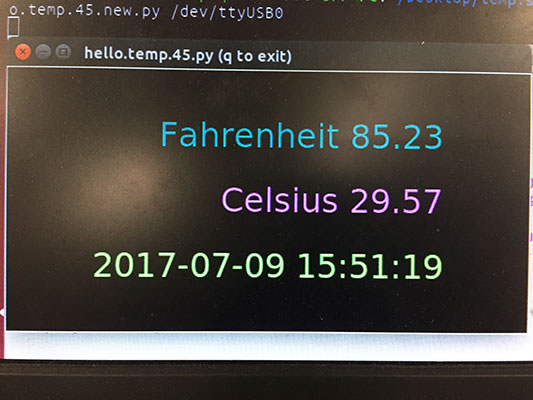
This brought up the app with all of the changes I made in my py file! See below.
Here is an actual picture of my temperature sensor and the screen below it.
More sophisticated code:
Python was a little bit more tricky then just working with C since I have become slightly more familiar with C lately. After much trial and error figuring out what the "canvas" is and how to add things to it and move them with the coordinates I added 3 lines to the canvas and took out the graph. kayla.hello.temp.45.new.py
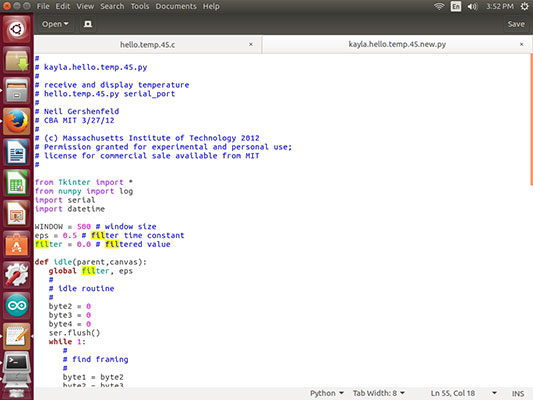
import datetime - inserts the date and time into the file
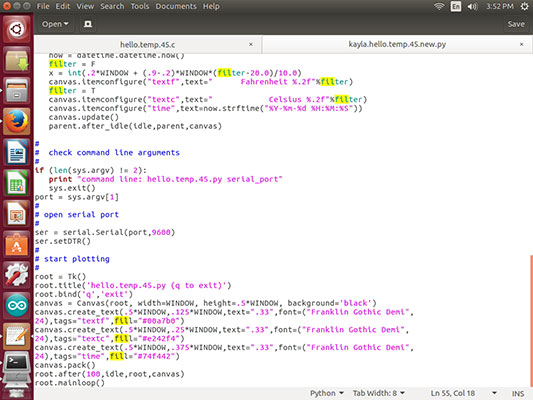
Then added textf for fahrenheit and textc for celsius and a time line with the year, month, date - hour, minute, second. Below I changed the colors in the textf, textc, time so they all were different and changed their position in the box with .125, .25, .375 to space them the same. The extra spaces above were to keep them in a line within the box that I also made taller and narrower. I kep the delay as well.
Week 16 Photos