Week 16: Interface and Application Programming
This week our task was to "write an application that interfaces with an input and/or output device that you made, comparing as many tool options as possible". I decided to write an application for my final project, the eTester.
Application
To design and code the application, I needed to create a GUI that included manual user inputs (like the mass of the sample), in addition to a FFT on the incoming amplitude signal sent from the adafruit board (sampled from the microphone board), and a simple equation that computes the elasticity of the sample from the input variables. The following details these components.
Graphical User Interface
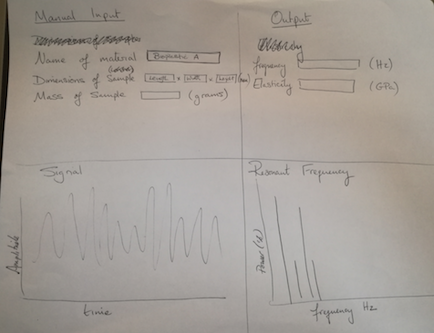
To begin, I listed the main parts of the user interface I wanted:
Here is a picture of the basic application schematic

I decided to use PyQT from Homebrew to first develop the application user interface. PyQT is a set of bindings to the QT framework for building applications (a GUI framework and can be binded to many programming languages). I also used the QCustomPlot widgit for PyQT as this allowed me to create plots in my application schematic. Some tutorials are found here
Here is the initial application interface mock up, programmed with pyQT
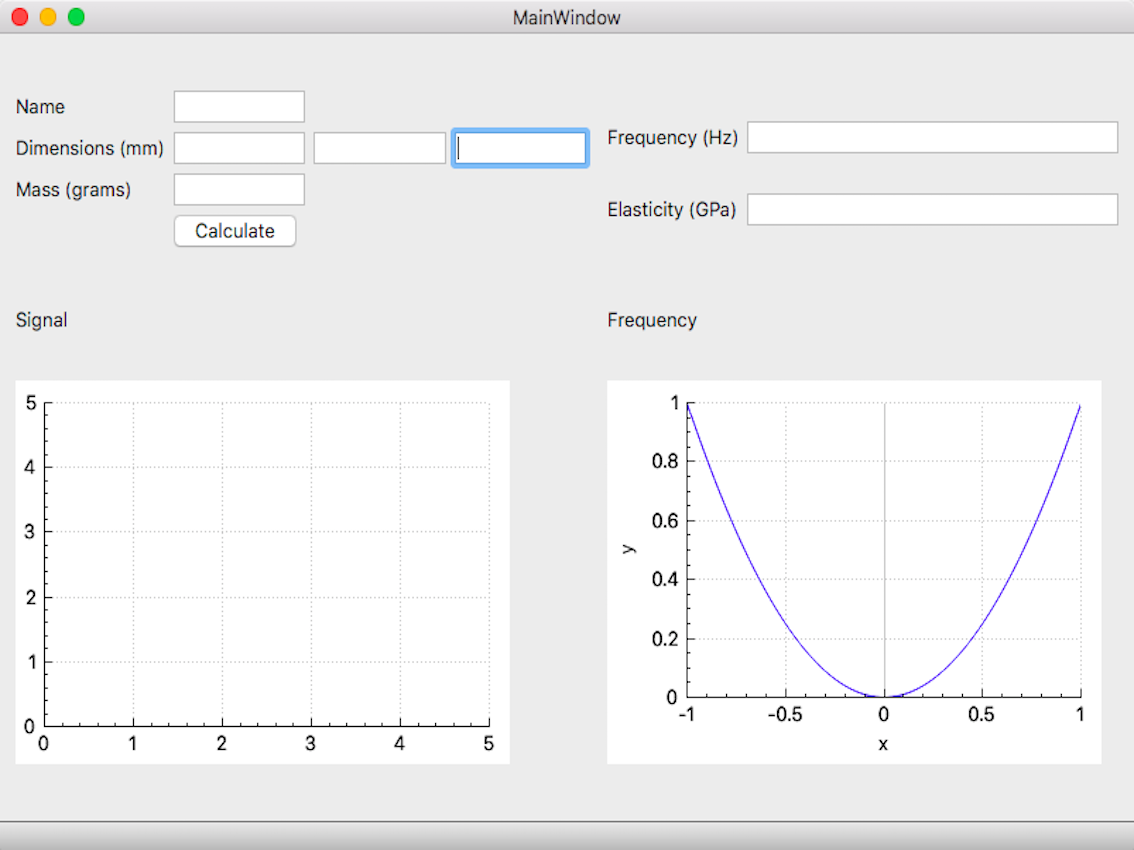
In the final version, this was simplified to show just the frequency and elasticity readouts in number format (see third video below). Integration of a graph format will be done at a later date (forthcoming).
Fast Fourier Transform Component
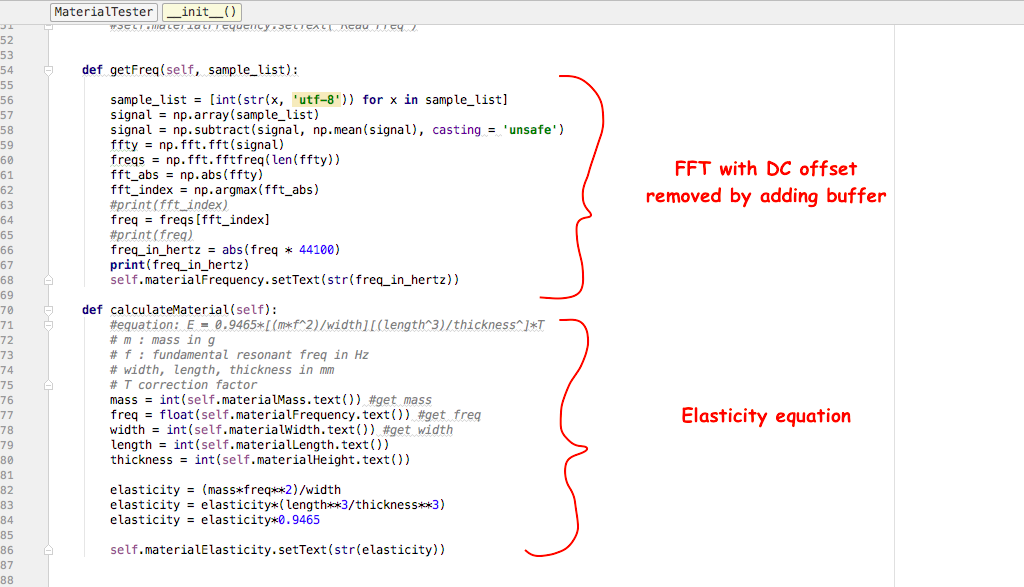
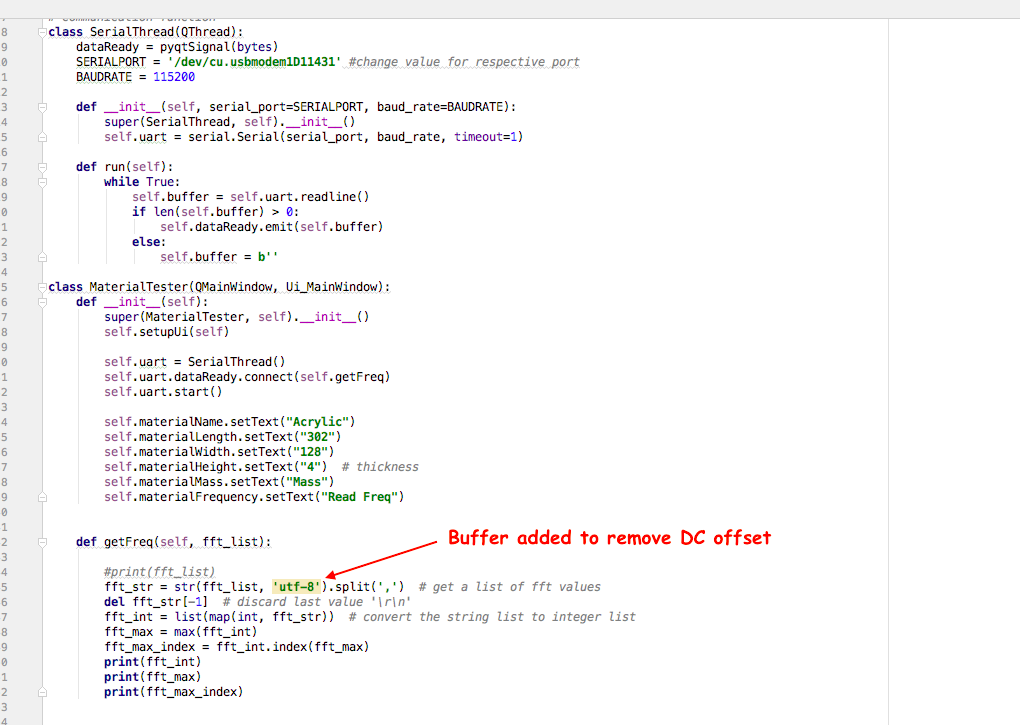
One of the main issues I found was the need to "remove the DC offset" in the amplitude signal before doing a FFT on the signal. The hit of the mallet on the sample causes a large DC offset, and doing an FFT on the signal without removing it causes a large frequency spike at 0Hz. This is problematic, as it prevents the smaller signal of interest from being registered (in my case, this is the resonant frequency of the vibrating material sample). A very instructive examplation of this can be found here. See below for a screenshot noting this in the code.
Nyquist Limit and the sampling rate
The rate at which the data needed to be sampled was critical to link to the frequency being measured. The 'Nyquist limit' is used as a rule in such situations, stating that the sampling rate should be at least 2 x the frequency wavelength. This is to make sure the frequency is read accurately. If you imagine a sampling rate that is the same rate as a the frequency, you would only read one part of the wave function. Because the vibrational frequency of materials being tested range (in general), from 10-100 Hz, I used 100 Hz as the upper range, and, just to be cautious, made the sample rate 2.5x this rate, giving me 250 as a sample rate. To make it easier computationally, we put the sample rate at 256 (so that it is base 2). See below for a screenshot noting this in the code.
Python coding
I then used PyCharm for my coding. The interface made it easy to understand the notation of python, and to organize and import files.
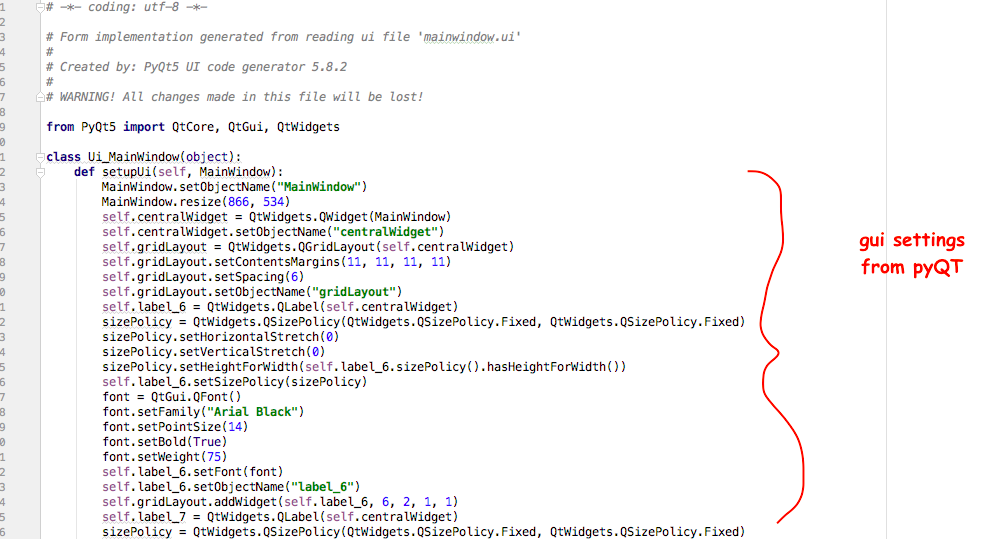
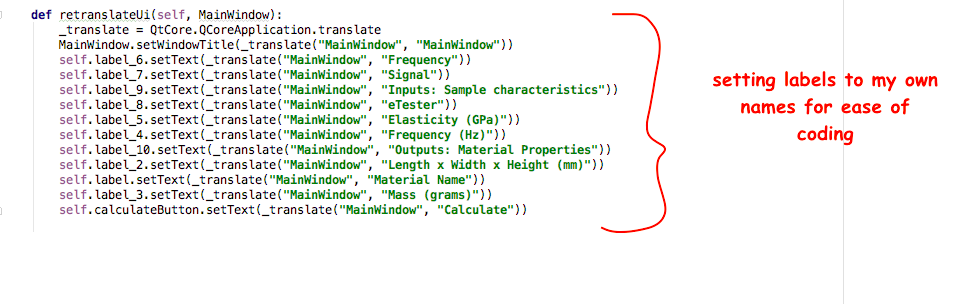
The following screenshots of the application code serve to explain the various parts noted above.

The final Application demonstration can be found on the Showcase page.
Here are the files from this week:
FFT program Main window GUI Elasticity measurement code