Week 16 - Interface and Application Programming
Assignment
- write an application that interfaces with an input &/or output device that you made, comparing as many tool options as possible
This week I tried two different tools for UI development: firstly I tried JavaScript and the NodeJS, a development framework new to me (but that I always wanted to try), and then I used Python, a language I'm quite familiar with.
Programming the board
Before working with the input board designed during week 13, I decided to use the hello board of week 6, using its button as an input.
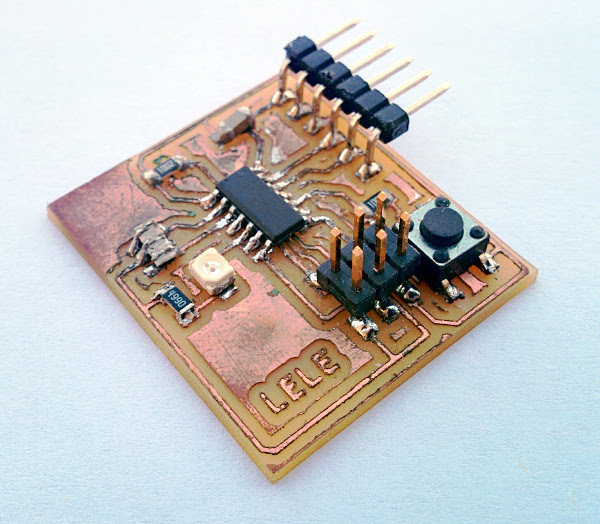
I started looking at the example magnetic field sensor board shown during this week class, but I came across a first issue while compiling the code for my hello board
Neil's hello.mag.45.c code is for an ATtiny45-based board, while my hello uses the ATtiny44. After a bit of googling, I found a code by Laura Perovic for a light sensor on the ATtiny44; since the ADC was used in a slightly different way, I checked the ATtiny44 datasheet and I discovered that, differently from the ATtiny45, there is not REFS2 bit in the ADCMUX - ADC Multiplexer Selection Register of the ATTiny44.
Hence, I modified the ADC code portion and set the right pin for the button (PA3)
   ADMUX = (0 << REFS1) | (0 << REFS0) // Vcc ref
      | (0 << ADLAR) // right adjust
      | (0 << MUX5) | (0 << MUX4) | (0 << MUX3) | (0 << MUX2) | (1 << MUX1) | (1 << MUX0); // ADC3 PA3 has pattern 000011
   ADCSRA = (1 << ADEN) // enable adc
      | (1 << ADPS2) | (1 << ADPS1) | (1 << ADPS0); // prescaler /128 (= 8MHz/128 = 62.5KHz)
Then, I recompiled the code. Everything compiled smoothly and the board began printing data onto the serial port through the FTDI.
Testing the tools
At this point, I had to travel a few hours by train and and no possibility to use attach hello board to my laptop. Instead of being stuck, I decided to write a small python script able to simulate the hello board running Niel's code.
The C code acquires 100 samples and computes the sum of all these values. Given the resolution of the ADC (10 bits) and the number of samples (100), the maximum value of the sum of the samples is 1023 * 100 = 102300.
To represent this number, we need ceil(log_2(102300)) = 17 bits, that is 3 bytes (24 bits).
The structure of the frame is quite simple: the n=3 data bytes are preceded by n+1=4 bytes for frame identification and synchronization. The first four bytes are a fixed sequence (1 2 3 4), then the three data bytes follows in little-endian order (that is to say, the least significant bytes comes first and the most significant bytes last).
00000001 00000010 00000011 00000100 X......X X......X X......X
   #1       #2       #3       #4     data 1   data 2   data 3
I wrote a small Python3 script which reads a number from the standard input, multiplies it by 100, assembles the frame and sends it through a serial connections.
import serial
import sys

ser = serial.Serial(sys.argv[1], 9600)
while True:   # stop with CTRL+C
	try:
		a = int(input())
		ser.write(b'\x01')
		ser.write(b'\x02')
		ser.write(b'\x03')
		ser.write(b'\x04')
		val = (a*100).to_bytes(3, byteorder='little')  # endianess is little!
		ser.write(val)
		ser.flush()
	except ValueError:
		pass
However, the code is supposed to run locally. Hence, a virtual serial connection is needed: to create a virtual connections, I used the socat command.
Socat is a command line based utility that establishes two bidirectional byte streams and transfers data between them.
$ socat -d -d pty,raw,echo=0 pty,raw,echo=0
2017/05/18 22:41:22 socat[17510] N PTY is /dev/pts/1
2017/05/18 22:41:22 socat[17510] N PTY is /dev/pts/2
2017/05/18 22:41:22 socat[17510] N starting data transfer loop with FDs [5,5] and [7,7]
In this example, the two end points of the connections are /dev/pts/1 and /dev/pts/2. What you write inside /dev/pts/1 can be read from /dev/pts/2, and viceversa.
So I created the two streams with socat and run the script with
python3 ./hello-button-sim.py /dev/pts/1
I used the script for testing my UI script, then I moved back to the hardware version. However, the script was really helpful to test the UI when no hardware was available and it also helped me to understand how the C code worked.
The UI - Javascript
Again, I used Neil's Node.js example (hello.mag.45.html and hello.mag.45.js) as a basis for creating the UI.
Firstly, I installed the nodejs packages that comes with Ubuntu 16.10. However, the nodejs 4.2.6 was a bit outdated, and I wanted to try a more recent version. So, I installed the most recent nodejs v7 with:
curl -sL https://deb.nodesource.com/setup_7.x | sudo -E bash -
sudo apt install -y nodejs
npm install ws
sudo npm install serialport --unsafe-perm --build-from-source
Then I run the script but it failed with:
$nodejs hello-button.js
DEPRECATION: Please use `require('serialport')` instead of
`require('serialport').SerialPort`
listening for connections from 127.0.0.1 on 1234
events.js:163
      throw er; // Unhandled 'error' event
      ^
      ...
I investigated a bit and the fatal error seemed related to the way constructor's openCallback was passed to .open(). I modified a bit the syntax code (you can find all the code at the bottom of this page) to make it compatible with the serialport v4.x package.
Then, I run again the script and I open the (untouched) web page... And it worked!
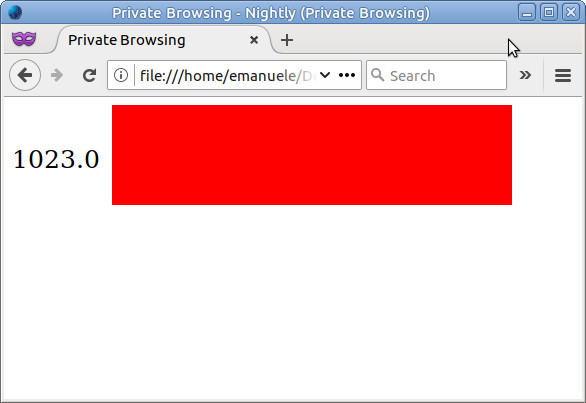
You can watch the video of the working interface reading the button of my hello board (since the push-button closes to a pull-up resistor, the value rises to 1023 when pushed)
The UI - Python & matplotlib
Next, I decided to modify the code I wrote a few month ago for an Arduino course. The original code read data as characters from the serial port, parsed and plotted them as is.
My code uses Matplotlib for plotting data in real-time. Matplotlib is a Python 2D plotting library which you can use to generate high-quality plots, histograms, power spectra, bar charts, error charts, scatter plots, etc., with just a few lines of code. For simple plotting, the pyplot module provides a MATLAB-like interface, which can be combined with the simplicity and power of Python to create plots.
I installed python3 and all the required libraries with:
sudo apt-get install python3 python3-matplotlib python3-serial
The plotting code is shown above: the plot is created, then a infinite loop reads data from the serial port and, when it recognizes the start frame sequence, it reconstructs the data and update the plot. The few lines at the end are needed to shift left by 1 the existing data, remove the oldest value and append the latest one.
import matplotlib.pyplot as plt
import numpy as np
import time
import serial
import sys

ser = serial.Serial(/dev/ttyUSB0, 9600)

fig = plt.figure()
ax = fig.add_subplot(111)

x = np.arange(100)
y = [0] * 100
li, = ax.plot(x, y, 'b')
ax.relim()
ax.autoscale_view(True,True,True)
fig.canvas.draw()
plt.ylim(-10,1033)
plt.show(block=False)

# loop to update the data
while True:
	try:
		val = 0;
		byte2 = 0
		byte3 = 0
		byte4 = 0
		ser.flush()
		#
		# find framing
		#
		while 1:
			byte1 = byte2
			byte2 = byte3
			byte3 = byte4
			byte4 = ord(ser.read())
			if ((byte1 == 1) & (byte2 == 2) & (byte3 == 3) & (byte4 == 4)):
				break
		data1 = ord(ser.read())
		data2 = ord(ser.read())
		data3 = ord(ser.read())
		val = data1+ 256*data2+256*256*data3
		val = val/100

		y[:-1] = y[1:]
		y[-1:] = [val]
		li.set_ydata(y)
		fig.canvas.draw()

		time.sleep(0.01)
	except KeyboardInterrupt:
		break
I run the Python script, I started pressing the button and the plot updated in real-time!
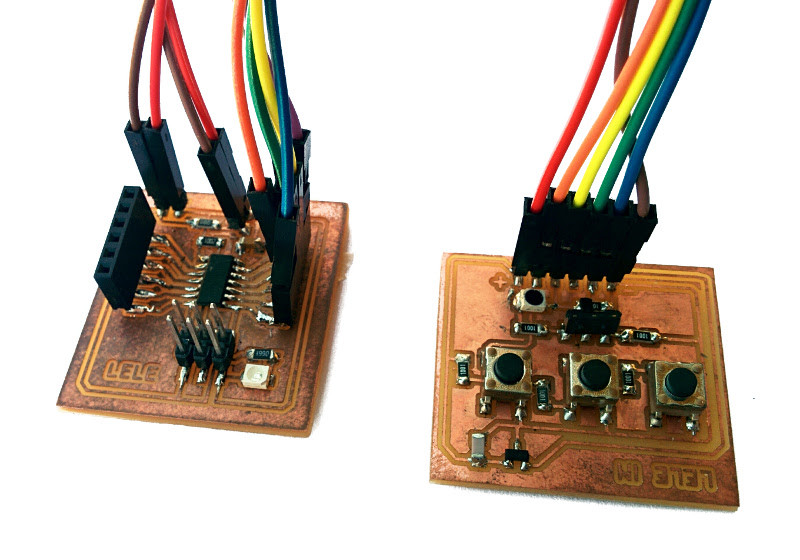
An UI for multiple sensors
During my week 13 - input devices I designed a board with 4 sensors: temperature, light, on-off switch, and a 4 buttons ladder. Temperature and light are analog values (converted to 10-bits values), while the on-off switch can be considered a binary value. The 4-buttons voltage ladder is a voltage input, that can be converted to 4 possible values; this means that 2 bits are enough for representing this value.
I decided to move the averaging part onboard and send only the final values. This resulted in a new 24-bits data format for sending the value of all the four input sensors.
1SBBTTTT TTTTTTLL LLLLLLLL
 data 1   data 2   data 3
Where 1 is fixed, S is the switch value, B refers to the buttons, T and L to temperature and light respectively. The resulting frame sent over the serial connection is the following (mind the endianess!)
00000001 00000010 00000011 00000100 LLLLLLLL TTTTTTLL 1SBBTTTT
   #1       #2       #3       #4     data 1   data 2   data 3
On the C code I assembled the frame before putting the chars out of the serial TX pin using simple bitmasking and bitshifting operations:
byte5 =light & 255;
byte6 = (((light >> 8) & 255) | ((temp & 63) << 2)) & 255;
byte7 = (((temp >> 6) & 15) | ((button & 3) << 4 ) | ((swt & 1) << 6) | 128) & 255;
On the receiver JS server code I reconstructed the original values using inverse bitwise operations. Please note that the temperature in Celsius degrees is obtained with the formula shown during week 13.
light = (byte5 + 256*(byte6 & 3))
temp = ((byte6 >>> 2) + 64*(byte7 & 15)) & 1023
temp_deg = ((temp * 5000.0 / 1023 - 400)/19.5).toFixed(1)
button = (byte7 >> 4) & 3
swtch = (byte7 >> 6) & 1
The WebSocket connection sends the data from the server to the webpage using JSON. The values are put into JSON string like this:
{"temp":180, "light":0, "button":2, "selector":0}
The graphic of the web page showing the values is the following: for SVG graphic containers includes text, rectangles or raw images.
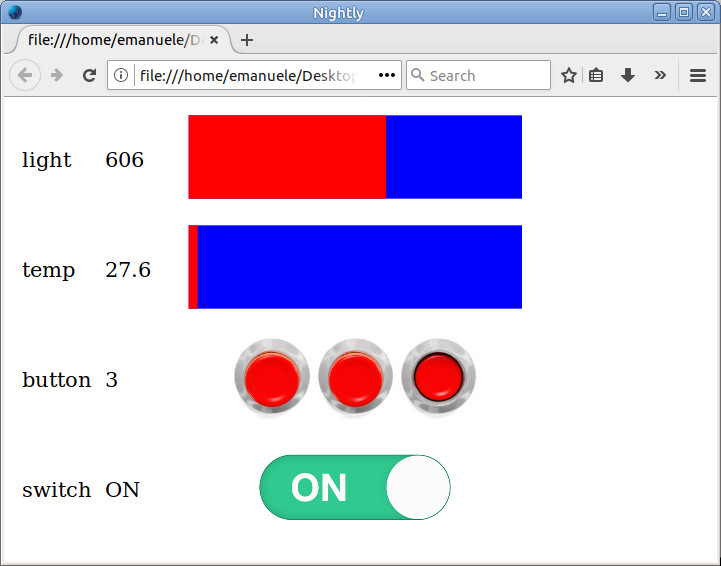
The JS code running on the web page receives the JSON, parses it and extract the values. Then, using DOM, the graphic elements of the pages are accessed through their IDs and are modified in real time. The code below shows how the elements are modified using the values obtained from the JSON.
values = JSON.parse(event.data)

document.getElementById("lighttext").firstChild.nodeValue = values.light
document.getElementById("lightrect").setAttribute("width",.8*values.light/1023)

document.getElementById("temptext").firstChild.nodeValue = values.temp
document.getElementById("temprect").setAttribute("width",.8*values.temp/1023)

document.getElementById("btntext").firstChild.nodeValue = values.button
for (i = 1; i <= 3; i++) {
 document.getElementById("btnimg"+i).setAttributeNS('http://www.w3.org/1999/xlink', 'xlink:href',
  (values.button === i)?"pressed.png":"unpressed.png")
}

document.getElementById("switchtext").firstChild.nodeValue = (values.selector===1)?"ON":"OFF"
document.getElementById("switchimg").setAttributeNS('http://www.w3.org/1999/xlink', 'xlink:href',
  (values.selector === 1)?"on.png":"off.png")
Watch the video below to see the code in action!
Download zone - List of files
- hello-button.tar.gz - ATtiny44 code for sending button value (.c + Makefile)
- hello-button-simulator.py - Python code for simulating the board
- hello-button-nodejs.tar.gz - Node.js code and Webpage for reading and show button value (.js + .html)
- hello-button.py - Python code for real-time plotting button value
- hello-sensors.tar.gz - C / JS / HTML code for real-time interface of my sensors board