Charting temperature data and saving temperature files
The final project is intended as a test bench for a feezer/cooler assembly. Therefore, monitoring temperature over time is a mandatory requirements. We woudl then be able to check the effectiveness of the PID control, have temperature data in different points that allow calculation of real time heat power dissipation, check reaction to different external temperature ranges, etc.
Another key aspect to consider, in consideration of the critical service that should be delivered by such a system (preserving biological samples over time), is the need to store temperature data. Besides, the resulting tables can be easily analyzed with spreadsheets.
I therefore addressed the two issues using the Processing language, particularly suitable in the Arduino environment
I set up to code a way to graph temperature collected by the slave board (freezer + cooler) and save a .csv file with this data at regular intervals, after a definite numer of readings
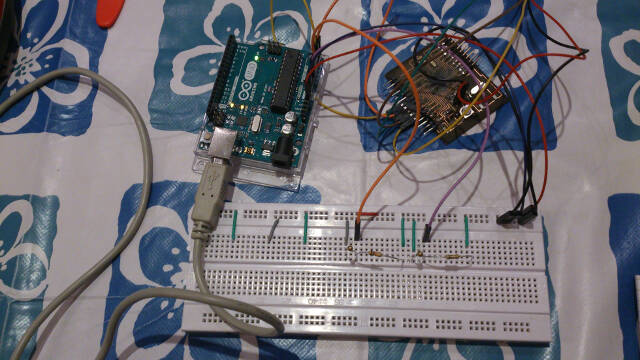
Once again, I devolped the code, after investigating different solutions over the web, and tested it using an Arduino as Master and the Satshakit as Slave.
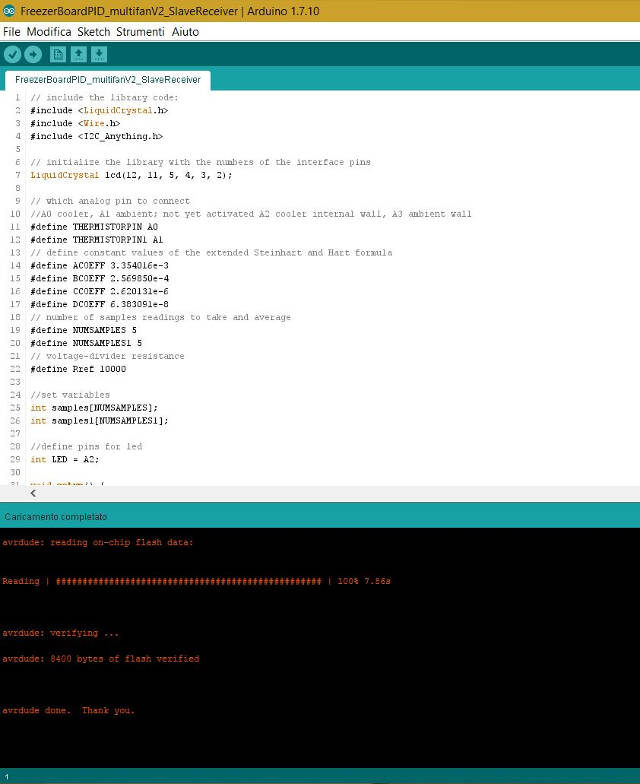
Uploading Slave Receiver code to Satshakit via FabISP
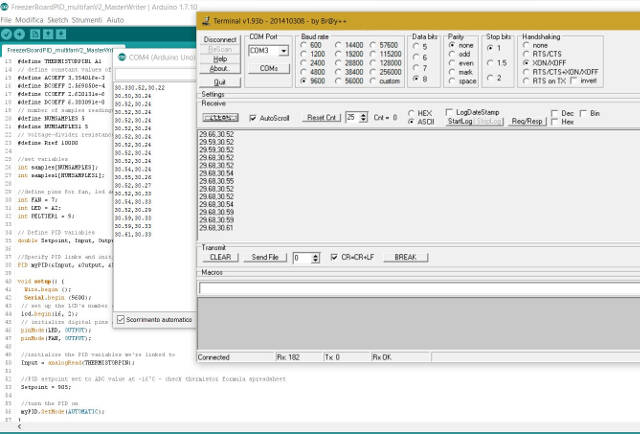
Comparing Master and Slave temperature readings via serial terminals
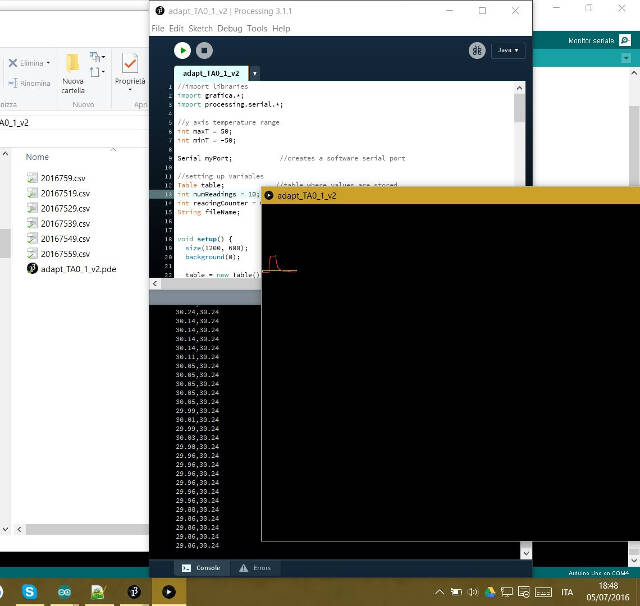
Plotting temperature vs time. In the background we see the .csv files saved in the same repository of the Processing code.
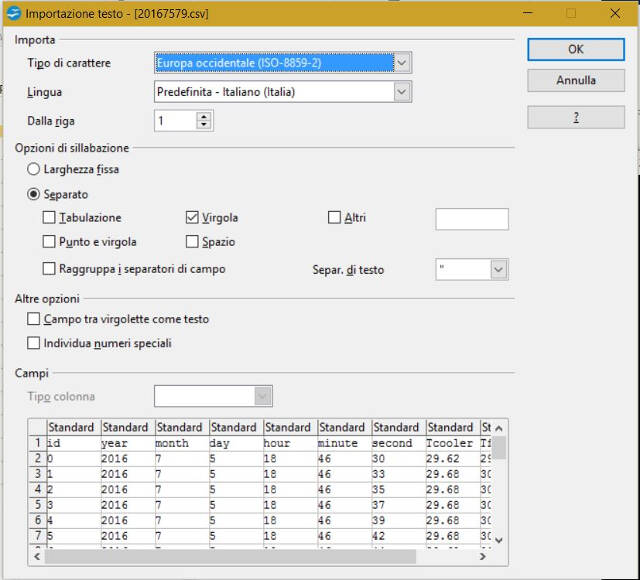
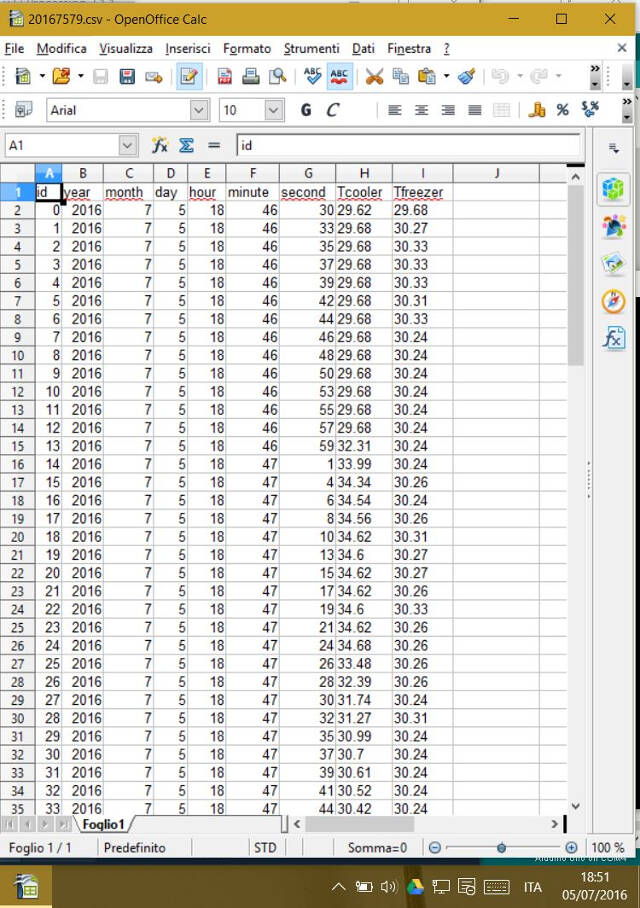
A .csv file opned with OpenOffice spreadshhet.