Interface and Application Programming
Goal
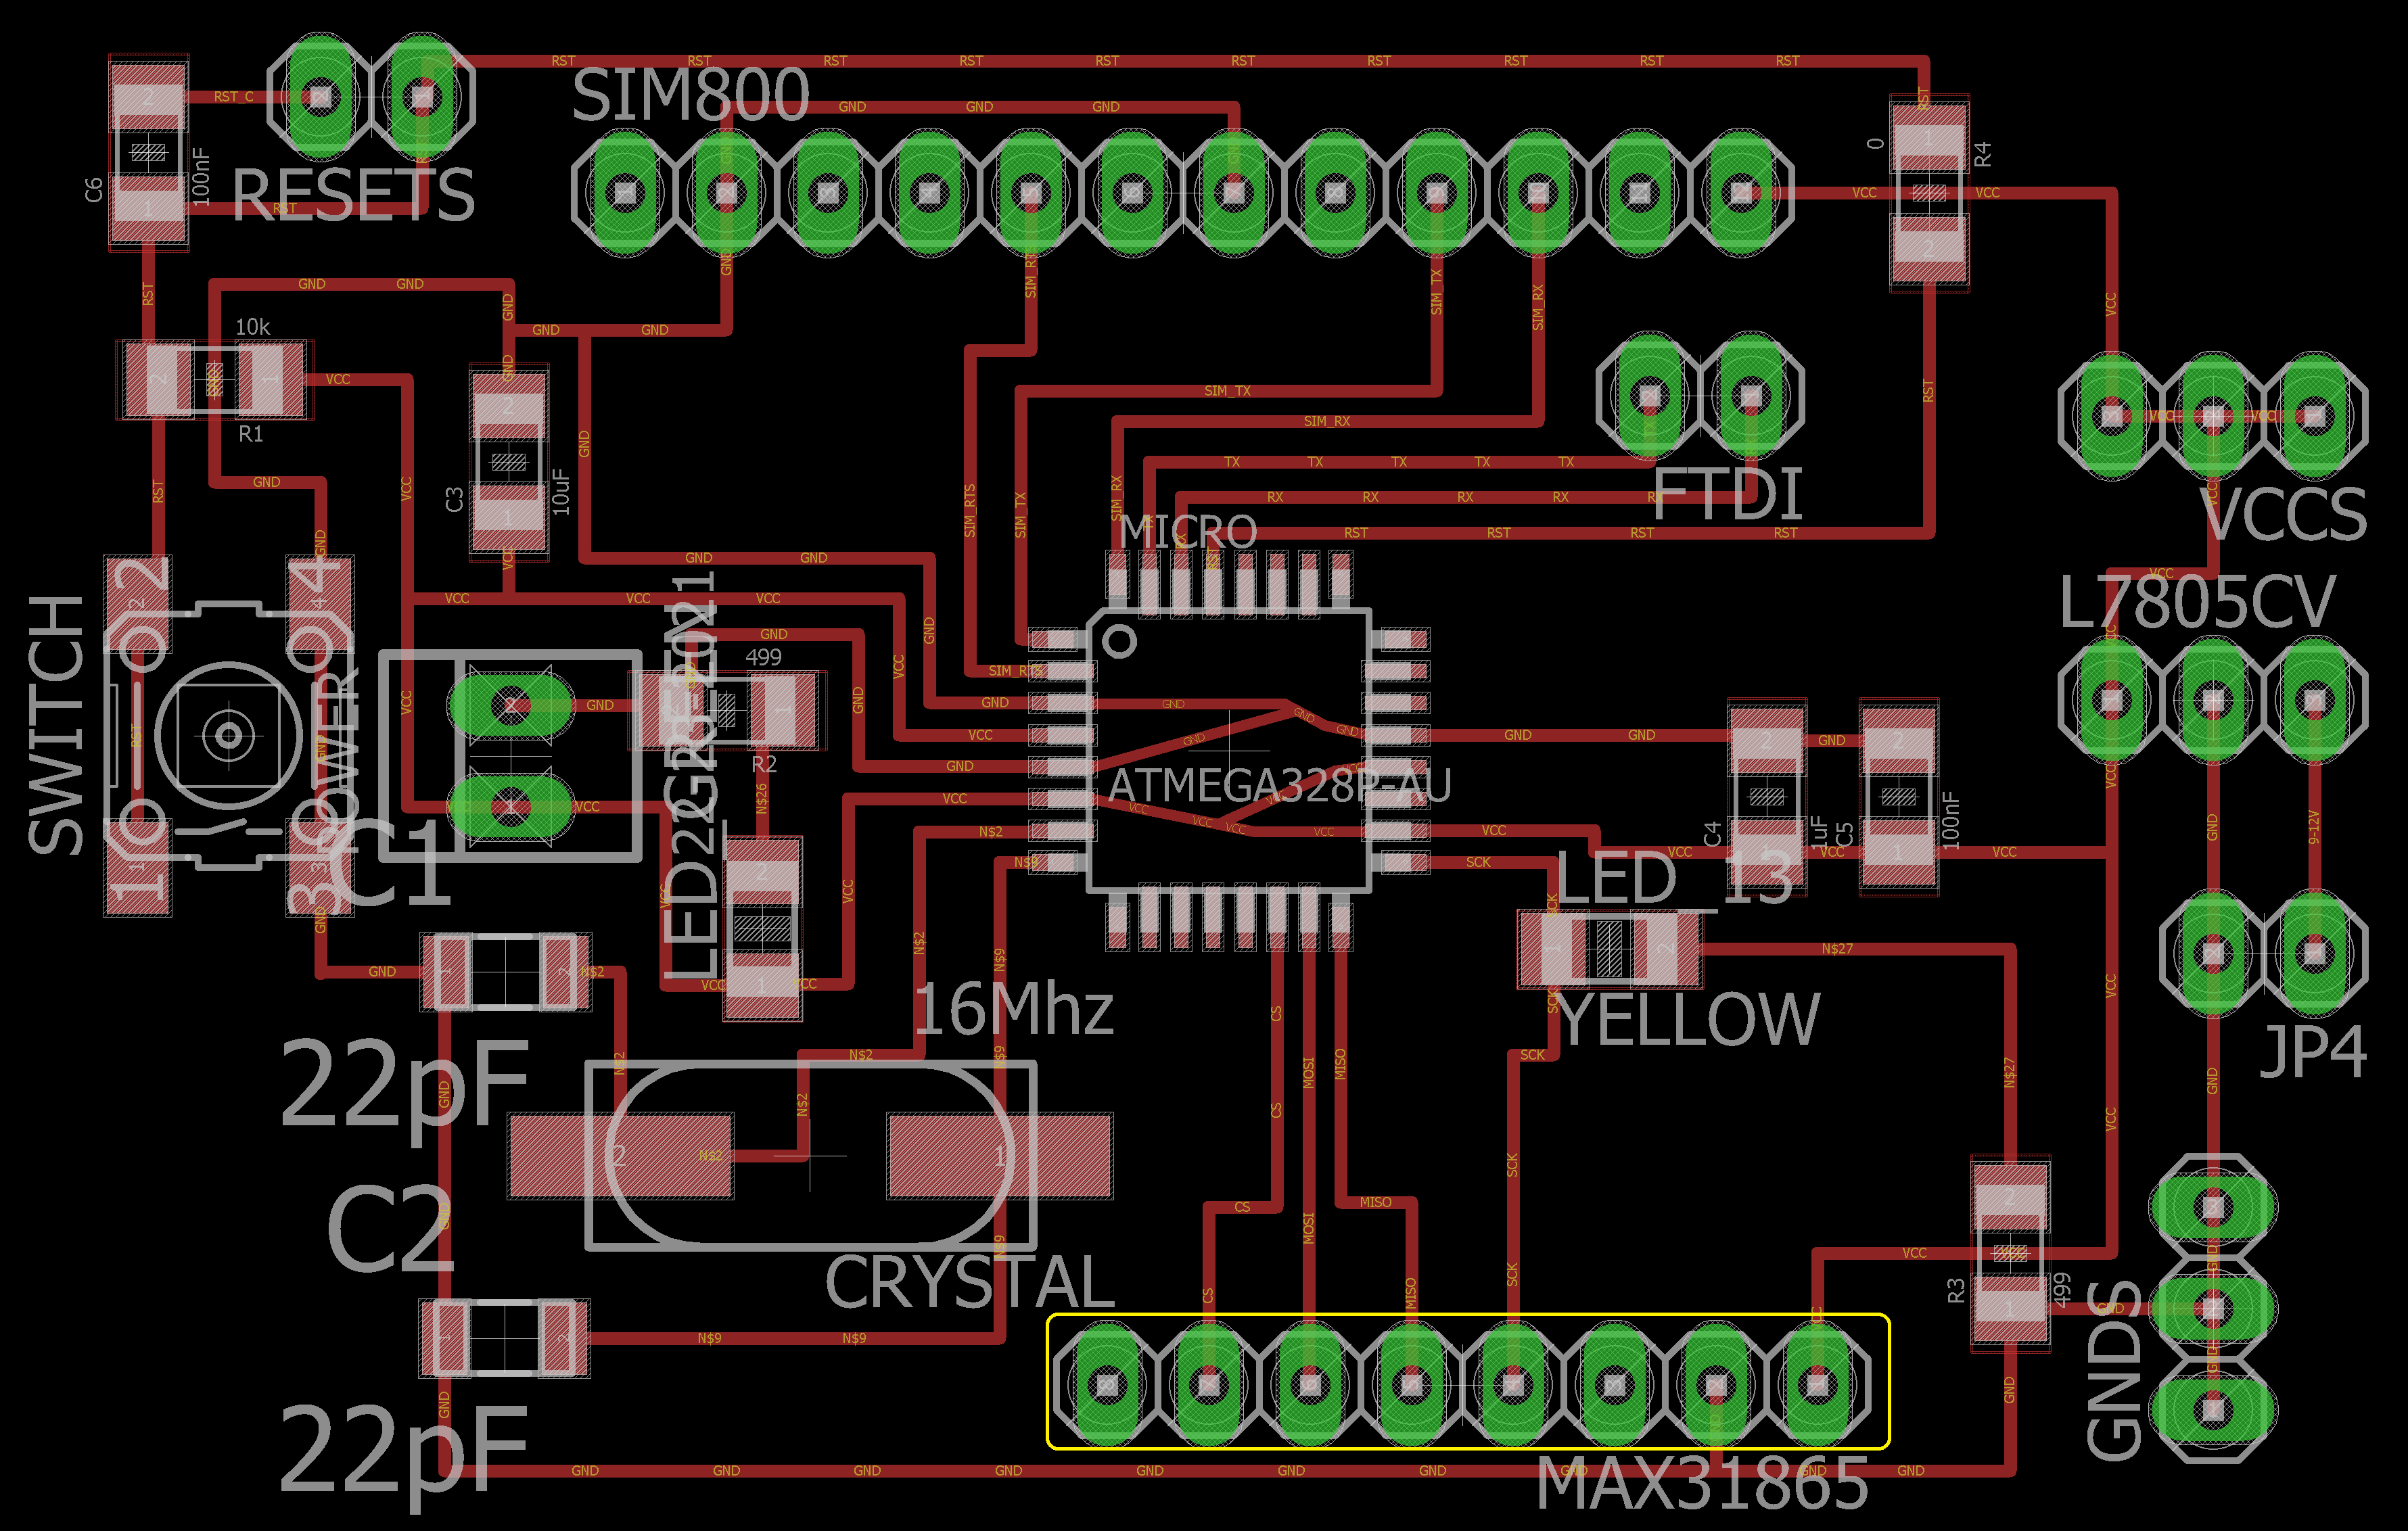
The assignment for this week was to write an application that interfaces with an input or an output device. I used the temperature sensor that I used in the Networking assignment also. My goal was to get temperature readings and then plot them in real time. The temperature sensor I used was the PT100 with a 2-wire configuration connected to an RTD amplifier MAX31865, connected to a board which I made in the Networking and Communications week.
Process
Application Programming is a whole new topic for me so my first step was to browse through some different application programming interfaces and choose the one that seemed the easiest for me to use. So, as I was browsing through the different interfaces I stumbled upon Processing
Processing can be used also with Arduino. After figuring out how to get started with Processing, I followed up some of its tutorials. After I understood how it works and what I am capable to do with that program, my next step was to figure out how to use it with Arduino. So, for that after a little bit of more searching, I followed up this Sparkfun tutorial which was very helpful.
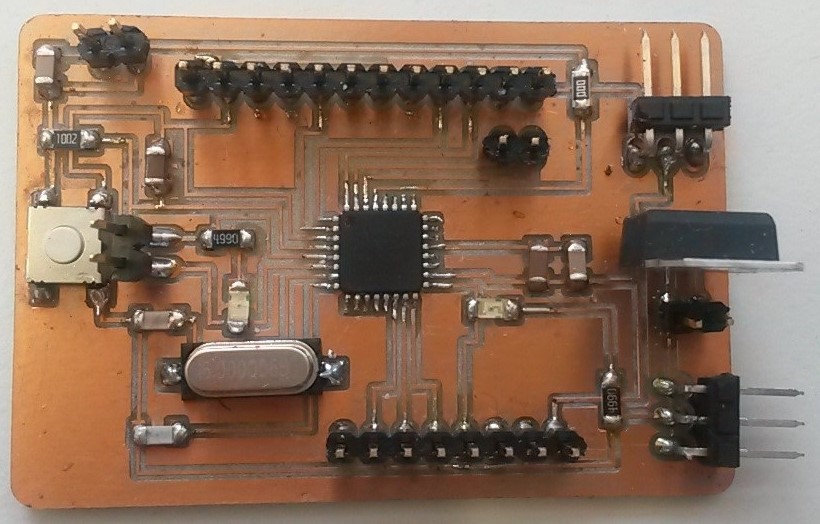
To recap a little bit, I used the PT100 sensor with a 2-wire configuration connected to MAX31865 RTD amplifier in the board that I made last week. Below, the board can be seen and the plug in place for the amplifier in which I connected it. For the download of the board, please visit the Networking and Communication week.
Software
So, after everything was ready thanks to the tutorials, I was ready to get started with the software. The procedure of the software consisted of two steps:
In processing, I had some problems receiving the data (mine were of the float type) from the serial port. It was particularly giving me the error of the null pointer exception. After some googling I found that this was due to the wrong way of the receiving of the data to Arduino. So basically, the solution that I found was receiving data in that of the "String" type and then converting it to float.
Another important note is that when running the code in Processing, Arduino is better to be closed. I did not encounter this problem but did it just in case as I read in some of the tutorials that is better as the data get distorted or the Processing software does not work. Below, you can find both, the Arduino and Processing codes.
//Arduino Code

//Adafruit library for the RTD amplifier
#include <Adafruit_MAX31865.h>

// Initialize RTD Amplifier
Adafruit_MAX31865 max = Adafruit_MAX31865(10, 11, 12, 13);

// The value of the Rref resistor. Use 430.0!
#define RREF 430.0


void setup() {
  Serial.begin(115200);
  max.begin(MAX31865_2WIRE);  // set the WIRE configuration
}


void loop() {
  uint16_t rtd = max.readRTD();

  float ratio = rtd;
  ratio /= 32768;
  Serial.println(max.temperature(100, RREF));
  delay(1000);
}
//Processing code

//import library for serial communication
import processing.serial.*;

int lf = 10; //linefeed in ASCII
String myString = null;
Serial myPort;  //setting up serial port communication
float temperature; // defining float value

int xAxis = 0;

void setup(){
  //setting up the exact port and baud rate
  myPort = new Serial(this, Serial.list()[0], 115200);
  //clearing up any readings the port may have from before
  myPort.clear();

  //setting up the window size of my graph and the background
  size(300, 300);
  background(255);
}

void draw(){
  //reading temperature value to string and converting it
  while (myPort.available() > 0){ //while there is data available from the serial port
    myString = myPort.readStringUntil(lf);
    if (myString != null){
      print (myString);
      temperature = float (myString); //converting string value
      println(temperature);
      // making the float temperature ready for plotting
      temperature = map(temperature, 0, 50, 0, height);
    }
   stroke(255, 0, 0);
   line(xAxis, height - temperature, xAxis, height/2);
   if(xAxis >= width){ //when the readings get to the end of the axis, it starts
     xAxis = 0;        //again from the beginning
     background(255); //setting up the background to white again
   }else{
     xAxis++;
   }
   myPort.clear(); //clear the port readings
  }
}
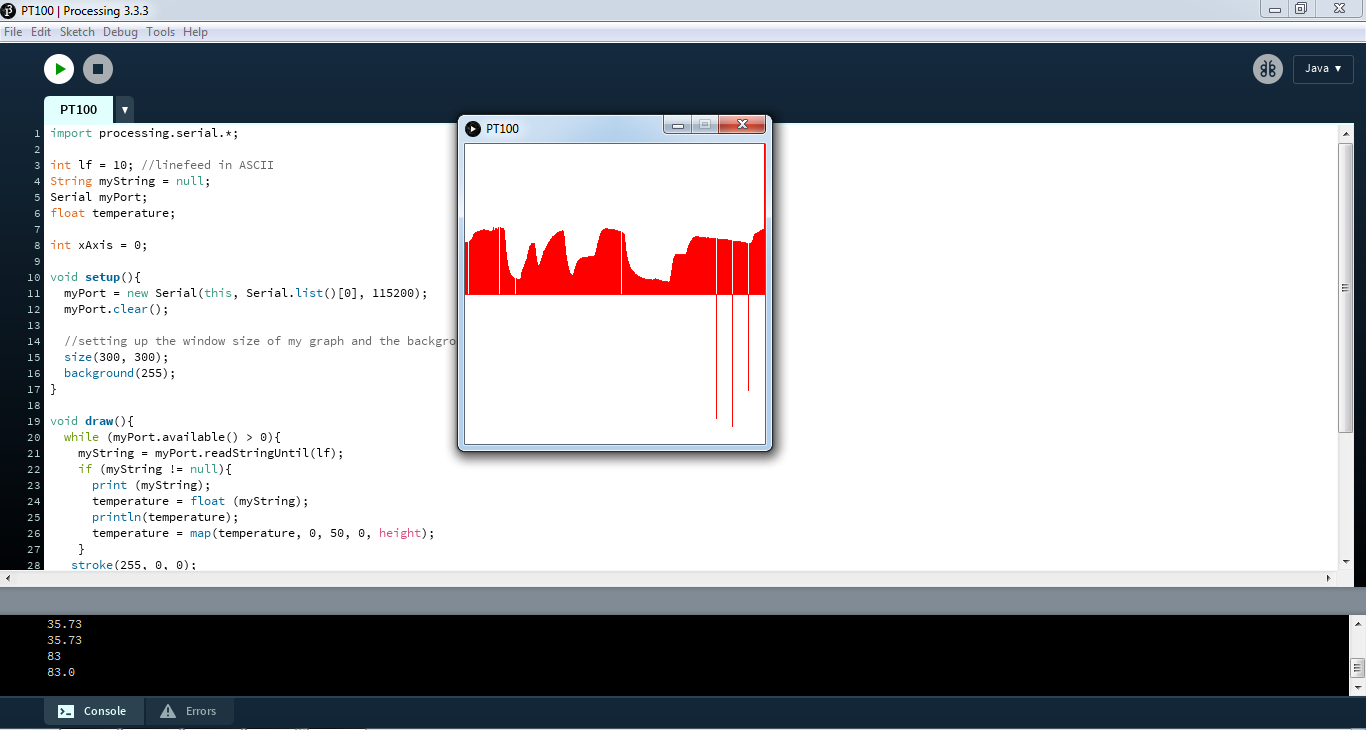
After we run the code, the resulting graph will look like the picture below (I was increasing and decreasing the temperature in order to see if the graph behaves accordingly). On some parts I get minus values or do not get values. I assume that is why I was sending multiple Serial.print's. I will try it again when I get the chance again in the near future.
Downloads