Interface
Representing data in a meaningful manner, for understanding information and for controlling devices
The Why of my assignment
Any data we get has to be represented, and a visual representation makes it easy for one to understand the data quickly. I have explored different options like Processing, MIT App Inventor and building a simple web app using Flask. The route of Flask and Webapp is easiest, as it can run on the same Raspberry Pi which is hosting my MQTT server, and provide a simple interface. A python script also part of the same folder called "publish to relay" pushes instructions to the relay controlling a pump or motor. The same script can control a servo in the future. I will be showing the Thingspeak-based version, the simple MQTT based Flask version, and my explorations with MIT App Inventor
How
I have used 4 different approaches to interface the hardware and software. For the longest time, I have used wifi to transmit data from my sensor nodes to a private instance of Thingspeak which would graph and store the data of water use. There are free apps to read data from Thingspeak or such customised instances, which I used. I also tried using Processing and MIT App inventor. I also built a flask app to read data off the mqtt database on the Raspberry pi.
HTTP-REST + WiFi + THingspeak on personal server
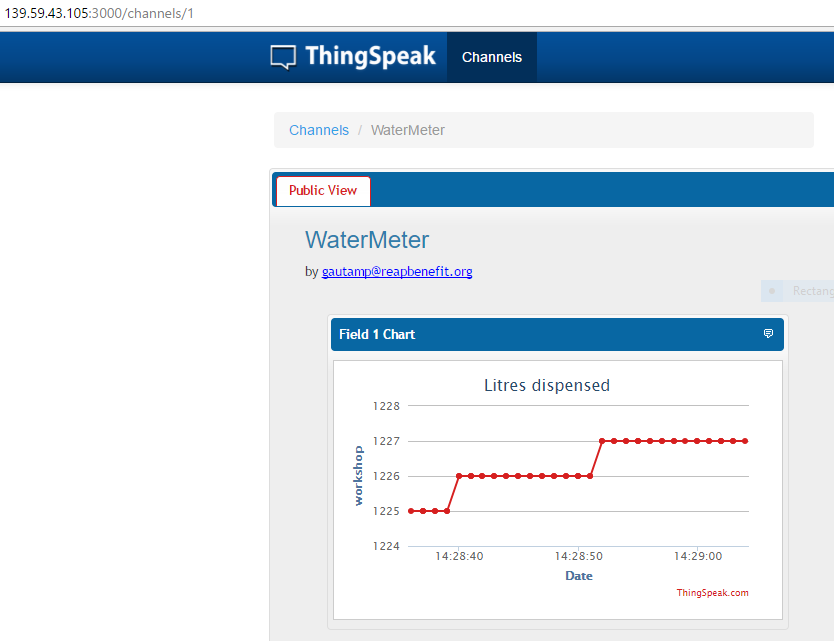
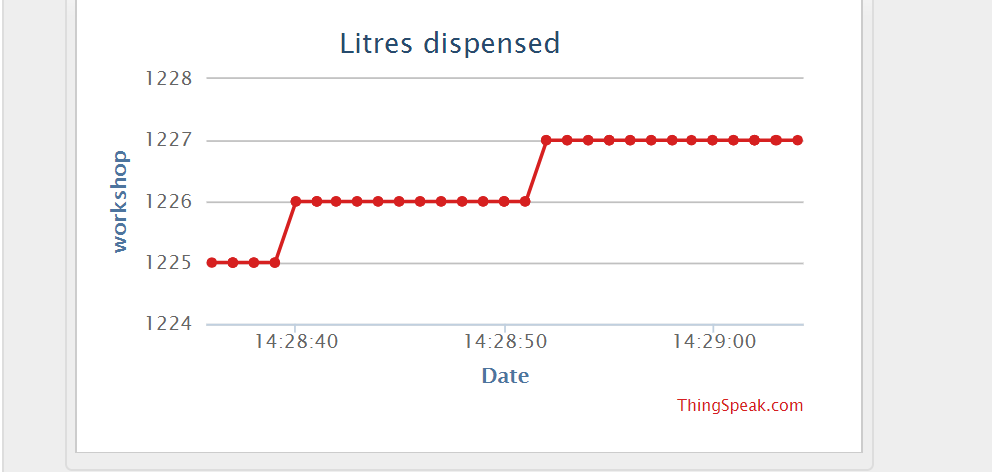
The first and longest attempt at data visualisation, infact, running from January, has been using WiFi on the ESP8266, pushing via HTTP-GET to a private instance of Thingspeak on my personal server. This has spawned into a similar service for a school I work with. The data can still be seen here. I was able to quickly use a free app on Google Play Store called ThingsView.
MQTT+Flask
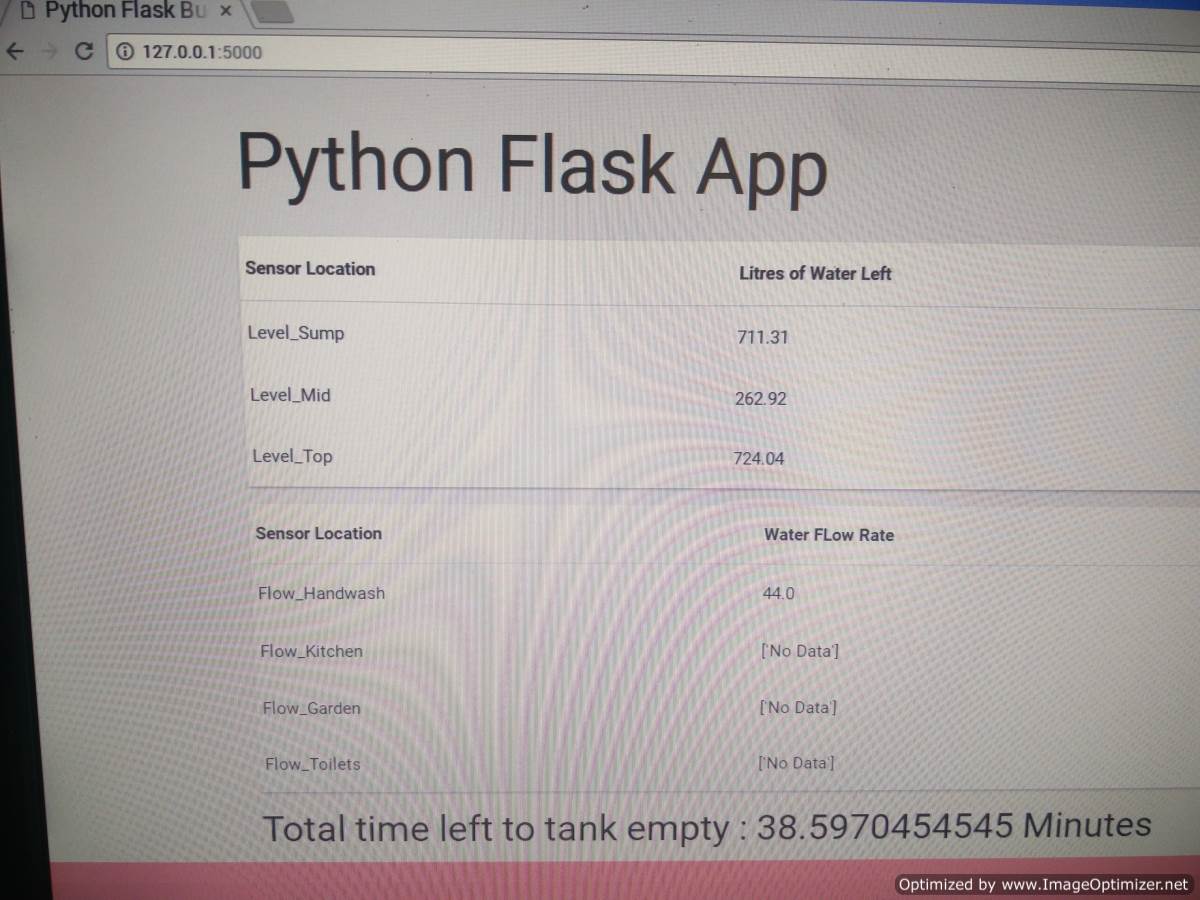
Since my server is a Raspberry Pi, running the Mosquitto service, and recieving data from the sensors - Flow (use of water) and Distance (amount of water left in tank, calculated by distance to water from sensor, which is on the top of the tank) sensors and controlling the access to water - Motor/pump/Solenoid valve. The .7z file of my complete python code is here - it contains the Python scripts to recieve data and store it on the databse, code to process the incoming data and code to visualise this data. I thank my friend, Aniruddha for his help with Flask. These close up images show the data recieved from the tank and the flow sensor 

Experiments with MIT App Inventor
1. Using MIT App Inventor
Starting the program is simple, you login with your Gmail address and you get a screen like this  . It urges you to do one of 3 options - connect your android phone to the app inventor app by downloading a companion app to the phone. Other options inlcude a native android emulator or a browser based emulator. This image shows how to install the android emulator on your windows PC. Click on it to see the .gif file
  I chose to use the emulator for a few videos and the Andoird native app for a few videos. Continuing on with the creation of an app, the screen took me to the default screen, which shows apps created. I clicked on the "Guide" button in the top right menu to arrive at this screen. Being curious on the components of the interface, I clicked on the link saying "Overview of Designer.." which took me to a small but functional overview like this. Once I read it, I selected the option to return to previous screen in the bottom of the screen and cam to this page where the tutorials to use the app came. . The first video talks about putting a button on your phone. NOTE any edits you make to the app are put on it in real time as long as you are on the same WiFi network. I created a test app like this by clicking on the "Start new project" button . Saving the project created a screen like this . I have linked the first video tutorial below.
I next clicked on the link to Teaching Curricula to see how more complex apps were built.
I chose to use the emulator for a few videos and the Andoird native app for a few videos. Continuing on with the creation of an app, the screen took me to the default screen, which shows apps created. I clicked on the "Guide" button in the top right menu to arrive at this screen. Being curious on the components of the interface, I clicked on the link saying "Overview of Designer.." which took me to a small but functional overview like this. Once I read it, I selected the option to return to previous screen in the bottom of the screen and cam to this page where the tutorials to use the app came. . The first video talks about putting a button on your phone. NOTE any edits you make to the app are put on it in real time as long as you are on the same WiFi network. I created a test app like this by clicking on the "Start new project" button . Saving the project created a screen like this . I have linked the first video tutorial below.
I next clicked on the link to Teaching Curricula to see how more complex apps were built.
Conclusion
For me, being able to code in Flask was a big learning. I was able to integrate the database and server on the the same device, which is also serving data for me now. It opens the world to me interms of visualisation post the Fabacademy. I want to integrate my data on to a Smart Mirror based on the same Raspberry Pi as shown here
I will also be able to integrate IFTTT next, so that the user gets a notification on his mobile next.