Assignment
Propose a final project that integrates the range of units covered, answering:
What will it do?
Who's done what beforehand?
What materials and components will be required?
Where will they come from?
How much will it cost?
What parts and systems will be made?
What processes will be used?
What tasks need to be completed?
What questions need to be answered?
What is the schedule?
How will it be evaluated?
What will Tropica - Data Logger Do?
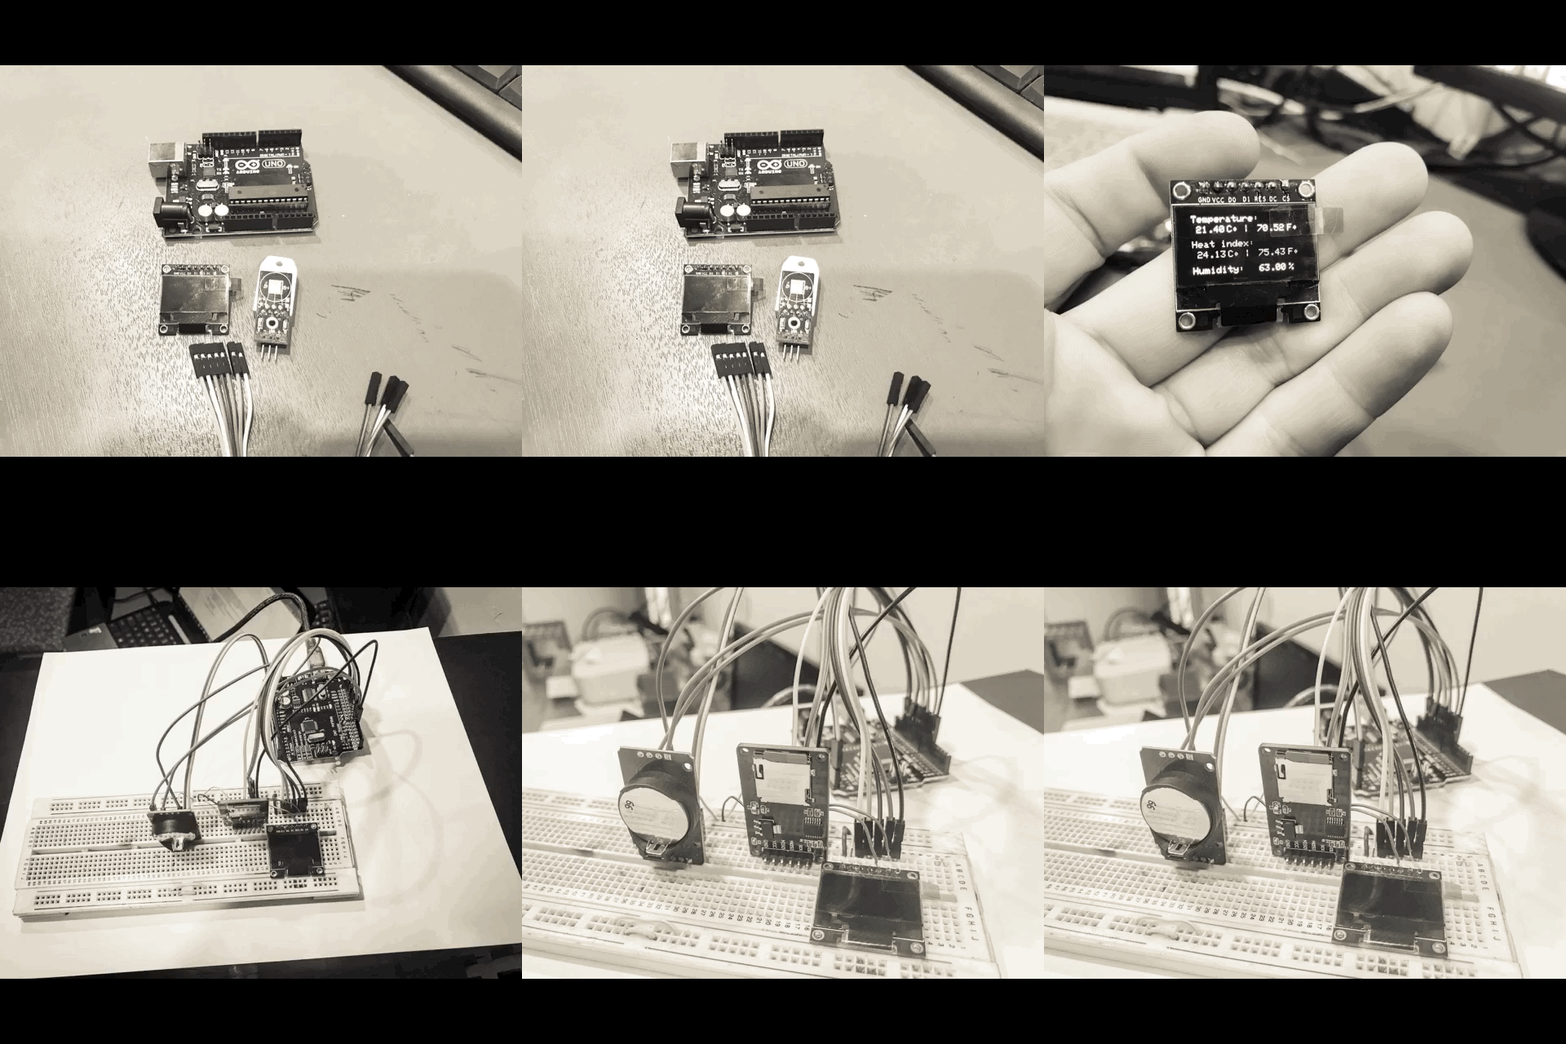
Tropica Data Logger will be a small device with an internal microprocessor, data storage, and one or more sensors, all housed in a hard plastic casing that is weatherproof and/or tamper resistant.
A data logger is an electronic instrument that records measurements at set intervals over a period.
Depending on the particular data logger, such measurements can include Air temperature, Relative humidity, AC/DC current and voltage, Differential pressure, Time-of-use (lights, motors, etc.) Light intensity, Water temperature, Dissolved oxygen, Soil moisture, Rainfall, Wind speed and direction, Leaf wetness, Pulse signals, Room occupancy
Who's done what beforehand?
Many projects are related to data and cities. A good part comes from open source projects and open hardware, following the model of smart cities. There are also many tutorials and instructions on how to make them, how to program them and how to interpret their data. It has many applications, from agriculture, architecture, biology and urbanism.
A commercial Data Logger costs around $ 150.00, most open source projects are under $ 100.00, all depends on the brand and quality of the sensors used. In Guatemala, there are no sensor suppliers and it is almost impossible to find components to develop the prototype.
Therefore, I have had to investigate many cases of data logger, I consider that the project is not relevant for its innovation, but rather it is important because in developing countries it is very important to measure data, record them and then analyze them to serve Making decisions in urban and rural planning and development.
The most important cases that bring experience to the project are:
Inputs Sensors: light, sound, temperatura by Tomas Diez - Fab Academy
Smart Citizen is a platform to generate participatory processes of people in the cities. Connecting data, people and knowledge, the objective of the platform is to serve as a node for building productive and open indicators, and distributed tools, and thereafter the collective construction of the city for its own inhabitants.
The Open Source Building Science Sensors (OSBSS) project demonstrates how to build inexpensive building environmental and operational sensors for long-term studies of the indoor environment using open source hardware and software.
Hobo Data Loggers Onset’s mission is to be a global leader in data logger and monitoring solutions used to measure, record, and manage data for improving the environment and preserving the quality of temperature-sensitive products. We are committed to a culture of continuous improvement, innovation, and world-class customer support.
Make: Urban Sensor Hacks Get started creating sensor-based applications to experiment and learn about the world you live in. Learn how sensor platforms make it easy and affordable to build and deploy numerous sensors in urban areas.
Senseable City Lab Urban imagination and social innovation through design & science. The real-time city is real! As layers of networks and digital information blanket urban space, new approaches to the study of the built environment are emerging. The way we describe and understand cities is being radically transformed—as are the tools we use to design them. The mission of the Senseable City Laboratory—a research initiative at the Massachusetts Institute of Technology—is to anticipate these changes and study them from a critical point of view. Not bound by the methodologies of a single field, the Lab is characterized by an omni-disciplinary approach: it speaks the language of designers, planners, engineers, physicists, biologists and social scientists. Senseable is as fluent with industry partners as it is with metropolitan governments, individual citizens and disadvantaged communities. Through design and science, the Lab develops and deploys tools to learn about cities—so that cities can learn about us.
What materials and components will be required?
Materials
1. PCB fabrication – phenolic paper $2
2. Ferric/cupric chloride $1
3. Tin for welding $0.50
4. Flux $0.50
5. Transfer $1.00
6. Protoboard $4.00
7. Jumper wire $4.00
8. Acrylic Case $15.00
Components
1. AT mega 328P $3.50
2. OLED display 128*64 spi $7.00
3. Button $0.25
4. Micro SD card adapter $3.00
5. Clock Module DS 3231 $3.00
6. Battery CR2032 $1.20
7. Capacitors 22 pf $0.25
8. Crystal 16 Mhz $0.40
9. Regulator 5 V 7805 $1.00
10. Battery Lion $2.50
11. Sensor DHT 22 (Temperature and relative humidity) $12.00
12. LDR $0.40
13. Resistor 10 K $0.10
14. San disk ULTRA SDHS Card with adapter $7.00
Where will they come from?
How much will it cost?
Materials and Components $69.60
Case Digital Fabrication $25.00
Total approximate $94.60
What parts and systems will be made?
Electronics Diagram - Design
Programming architecture
Programming IDE Arduino C++
User interface design
PCB production
Case Fabrication
What processes will be used?
Electronics Design
Electronics Production Input DevicesWhat tasks need to be completed?
Research the operation of the modules and type of communication
Adapting the modules to the end of the data logger: record hourly time temperature and relative humidity
View through the user interface the data in real time
Obtain the date and time using a stand-alone clock
Main sensor data acquisition
Correct PCB operation
Interpretation of data using graphs in Excel (spreadsheet)
What questions need to be answered?
Project feasibility - economically and technically
Need of the product
Usefulness of data collected
How will it be evaluated?
Developing a prototype to measure data on temperature, relative humidity and brightness
Match the collected data with graphs to interpret the information
Measuring the operation for long periods (one week recording data)
Tropica Data Logger
Grabado en madera from La Granja Fab Lab on Vimeo.