Week 16: Interface & Application Programming
Task
For this week we have to write an application that interfaces with a selfmade input &/or output device. I will program an interface to visualise the sensor data from my final project. See Neil´s lecture video and content page here.
Workflow
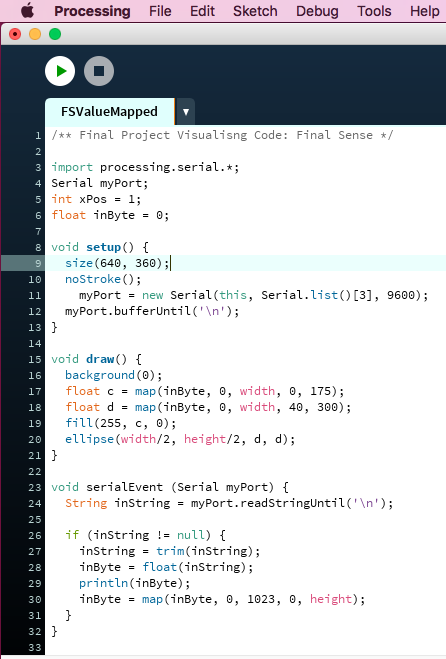
I want to use processing and started with browsing the example sketches. For my project, displaying the value number and visualising intensity in a graph makes most sense. However, this is actually an example code. In order to learn I will use this example code but added to the map example code, a circle which changes colour according to sensor data intensity.
My Final Sense code already has the serial read included, which makes things much easier. I basically combined the arduino graph example sketch with the map example sketch. I copied in the serial definitions (from graph) into the map code. In the map code I exchanged the previous settings that changed ball size according to mouse position with the sensor value (from mousex to inByte). Now the sensor value intensity is displayed in the size of the ball.
Interface from Norma D. on Vimeo.
Download All Files