Assignments:
- Write an application that interfaces with an input &/or output device that you made,
- Comparing as many tool options as possible
--- WORKFLOW ---
I will try to follow this workflow for this week.1. Experiment with processing and do some basic processing tutorials.
2. Try to create an interface (simply).
3. Make a more advanced interface using an input.
4. Try to view sensor from python.
1. Experiment with processing and do some basic processing tutorials.
WHAT IS PROCESSING? However I found this error related to java:
After much testing, and changing the input programming, I got my capacitive pressure sensor to work.
From now on I will be able to work more seriously for the final project and adjust the pressure sensor.
Processing is an open source integrated programming language and development environment based on Java. It was started by Ben Fry and Casey Reas from reflections on the Aesthetics and Computation Group of the MIT Media Lab led by John Maeda.
Processing is a nice environment for me becouse it looks a lot like arduino,
The first thing I did was to see processing rules (Very similar to those of arduino)
And then see what elements he could work with.
MAIN ELEMENTS VIEWED:
-setup () Boot function when the program starts. Same as Arduino.
-draw () Loop that runs cyclically always. Like the Arduino loop ().
-size (x, y); With this function, Processing creates a window of X pixels by Y pixels. In this window we will create our graphical environment.
-background (0,0,0); Determines the background color of the window created in RGB mode
-stroke (0,0,0); Stroke (border) function allows you to change the color of the current drawing in RGB mode. Each drawing function called after stroke will have the color of this stroke.
-noStroke (); Borderless.
-point (x, y); Creates a point in the x, y position of the graph.
-line (x1, y1, x2, y2); Create a line. The first two values are the first X, Y coordinate. The last two values are the last X, Y coordinate.
-triangle (x1, y1, x2, y2, x3, y3); Draw a polygon with three points. It has six values which are the three coordinates of the three points.
-quad (x1, y1, x2, y2, x3, y3, x4, y4); Draw a polygon with four points. The eight values are the four coordinates of the four points.
-rect (x, y, width, height); Draw a rectangle. The first two values are the X, Y position in the graph. The last two values are width and height respectively.
-ellipse (x, y, width, height); Draw a circle. The values work out of the Mass as well as rect.
-fill (0.0.0); Fill the color indicated in the figure.
-noFill (); Not filled with color.
-text ("text", x, y); Write a text at the desired X, Y position.
-mousePressed (); Call function every time the mouse button is pressed.
-mouseReleased (); Call function every time the mouse button is not pressed.
-KeyPressed (); Call function every time you press a key on the keyboard.
-year () Returns the current year of the PC's clock
-month () Returns the current month of the PC clock
-day () Returns the current day of the PC clock
-hour () Returns the current clock time of the PC
-minute () Returns the current minute of the PC clock
-second () Returns the current second of the PC clock
These are the elements that I have tried and that have helped me to start creating my GUI.
Tutorials.
After seeing some processing + Arduino tutorials and some examples of the official web of processing
The first errors appear.

First error in comunication serial.
The first mistake made me lose enough time,
In the tutorials when they put this command to communicate in series with the board usually put this value (1)
This was the solution that I finded, the error was the number of serial list not the baudios of speed .
Once this is resolved I started to see the tutorials, and to create a canvas from 02. Try to create an interface (simply).
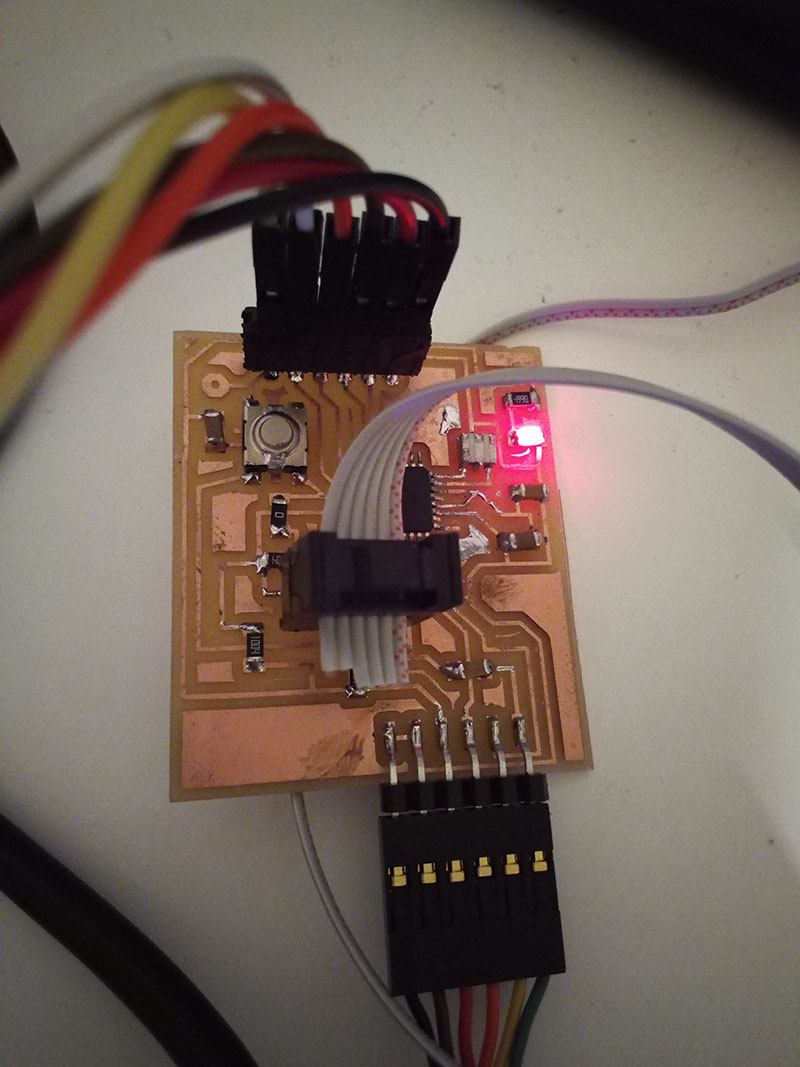
This is my input, I will try to comunicate with him and visualize the information.
One of the tutorials that I realized was to make the LED of my input board light on arduino, and through processing, control with an interface that led was turned on or off by serial communication.
This tutorial was different but I have adapted to my plate and what I wanted, in the tutorial worked with a temperature sensor that lit a rectangle when passing a temperature
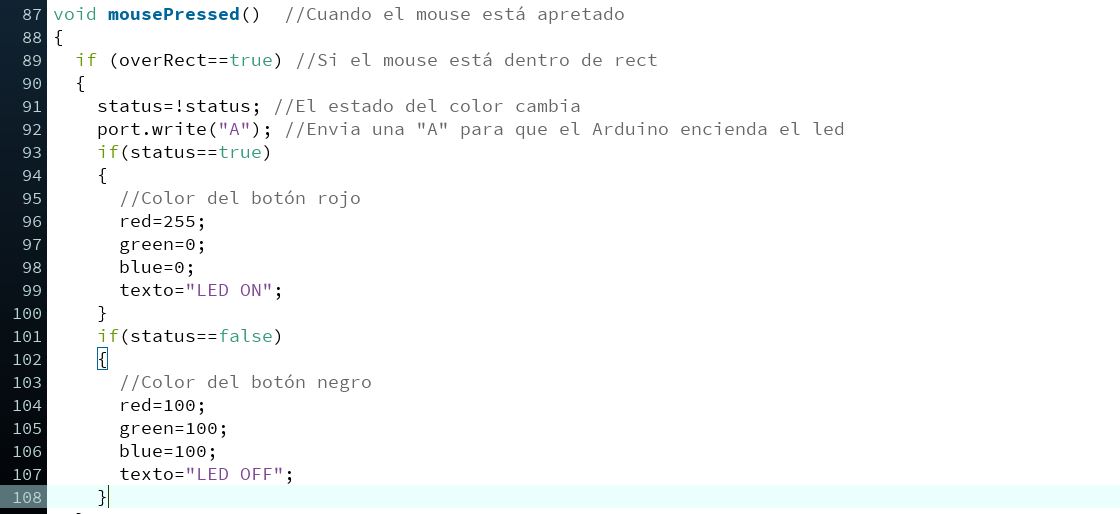
That makes? : Turn on the led with serial communication, also shows the logo of my final project and it can be moved using the keyboard. When you press the button it also changes the text between led on and led off, as well as the color of the button rectangle.
The process was as follows.
Create the program in arduino, which is very simple.
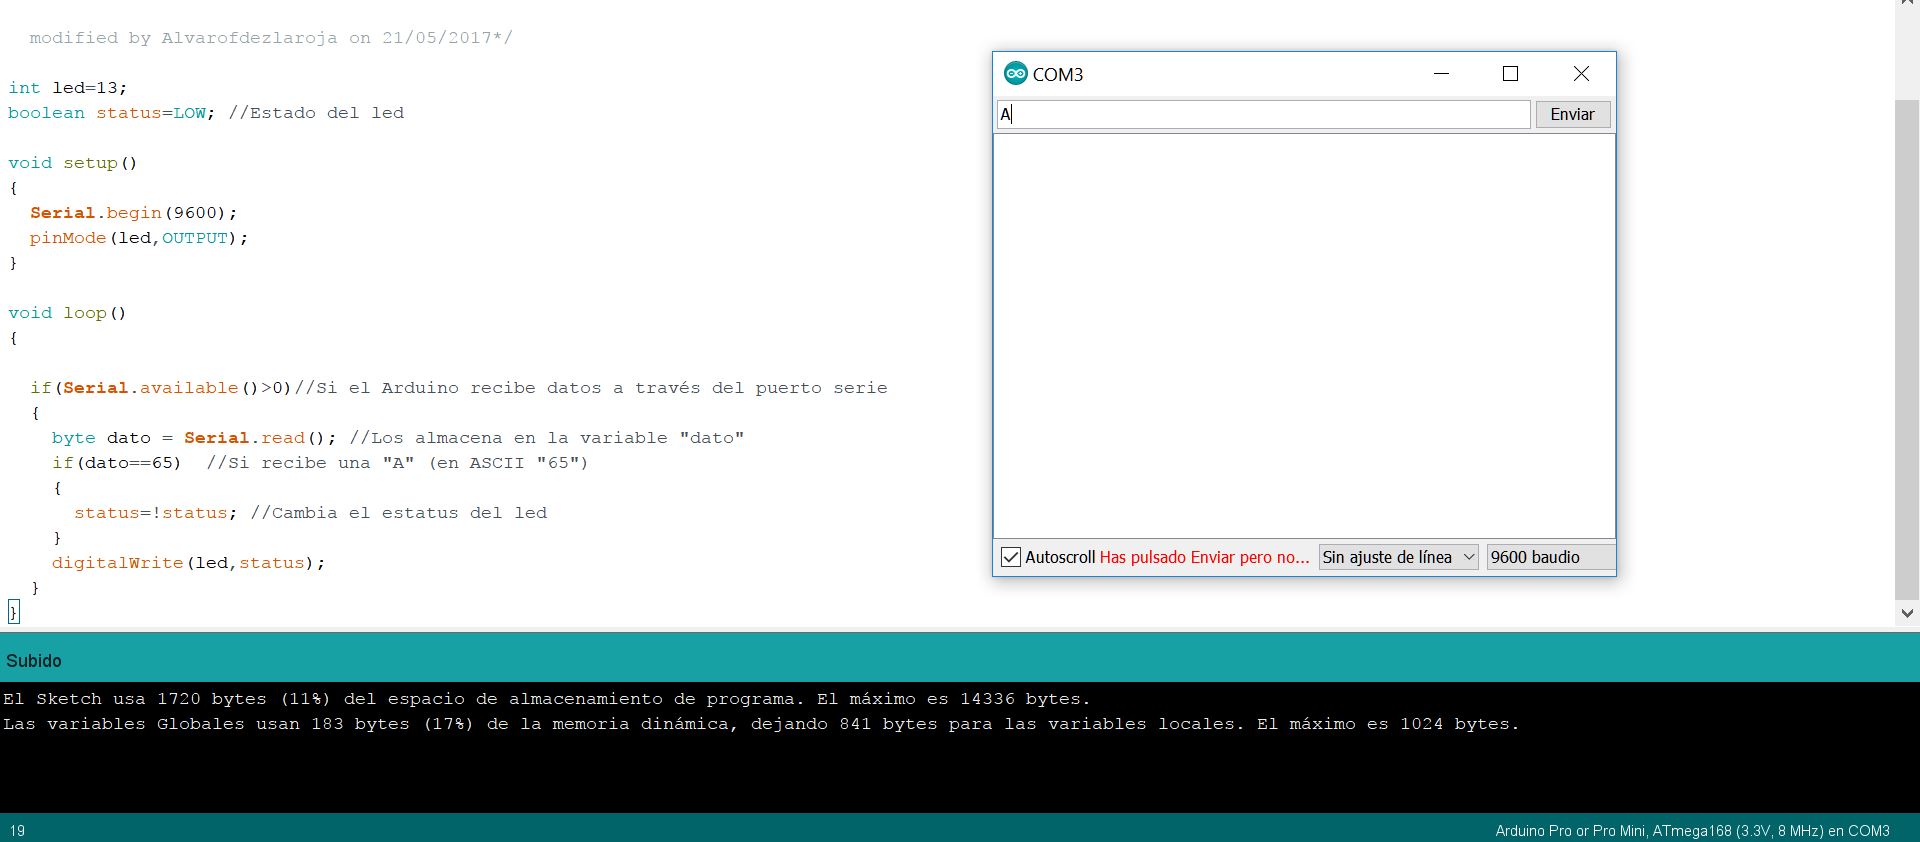
When you send A command in serial, the pin turn on/off.
And this is the process in the processing:
Highlights:
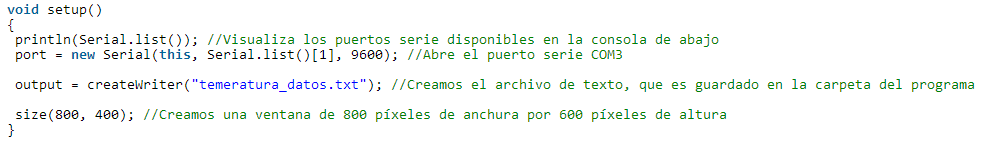
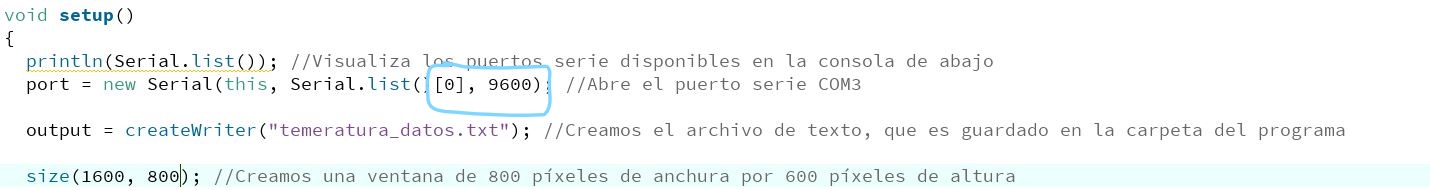
-It has to change the index of Serial.list () [1] by the index corresponding to the serial port that is connected our plate "VERY IMPORTANT IS 1". In the console below you can see the index once the graphical environment has started.
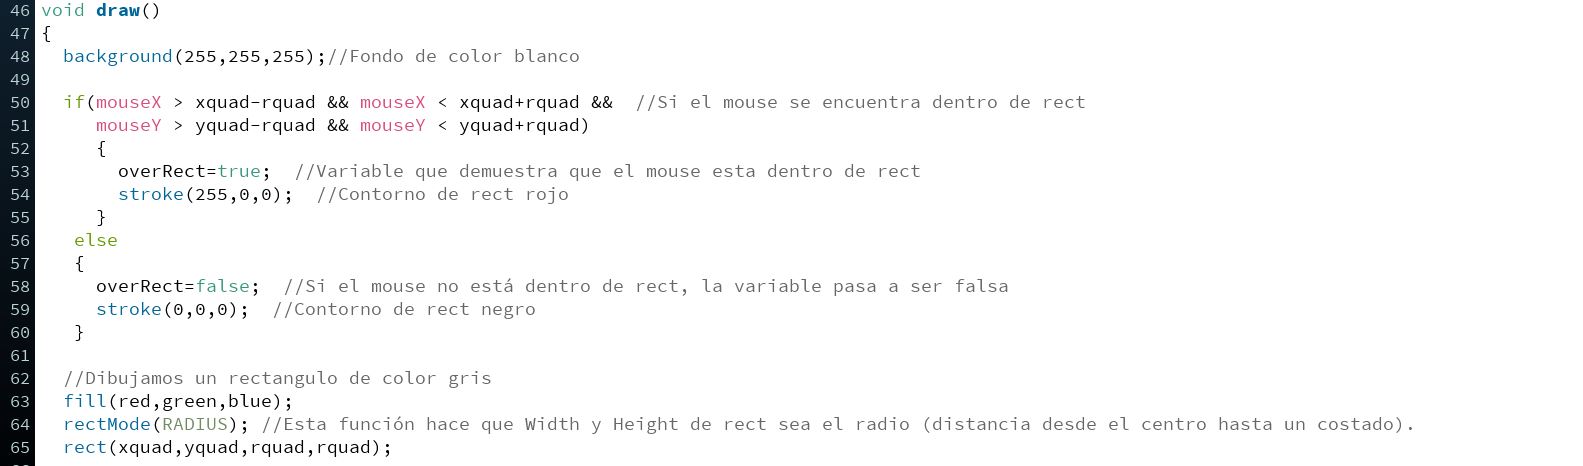
-This part is used to detect when the mouse is inside the button to change the state of the led. The exact coordinates of the entire surface of the rectangle have to be adjusted. We have that the center of the rectangle is in the position (200,200),
if we subtract the radius of the rectangle (that is 40 pixels) we will have the left limit and lower limit of the rectangle. And if we add the radius, we will have the right limit and upper limit.
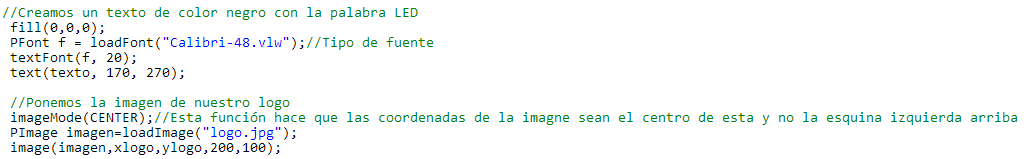
-PFont f = loadFont ("Calibri-48.vlw"); With this function we can put the type of font for the text. We have to go to Tools, Create Font ..., select the desired font, press Ok, and Processing will create a folder called data within the folder of the code where it will save the font type. Then we have to put the name of the type of font that we have selected inside the quotes of the function.
-PImage image = loadImage ("logo.jpg"); Used to load an image into the graphical environment. This image we have to save it inside the data folder. In quotation marks you have to put the name of the image. The following line is used to determine the position of the image and the dimensions.
- When we finish the graphic environment by pressing the "E" key, the text file where the temperature values of the sensor are saved ends. If we open it we will see the following.
And this is what the processing monitor shows.
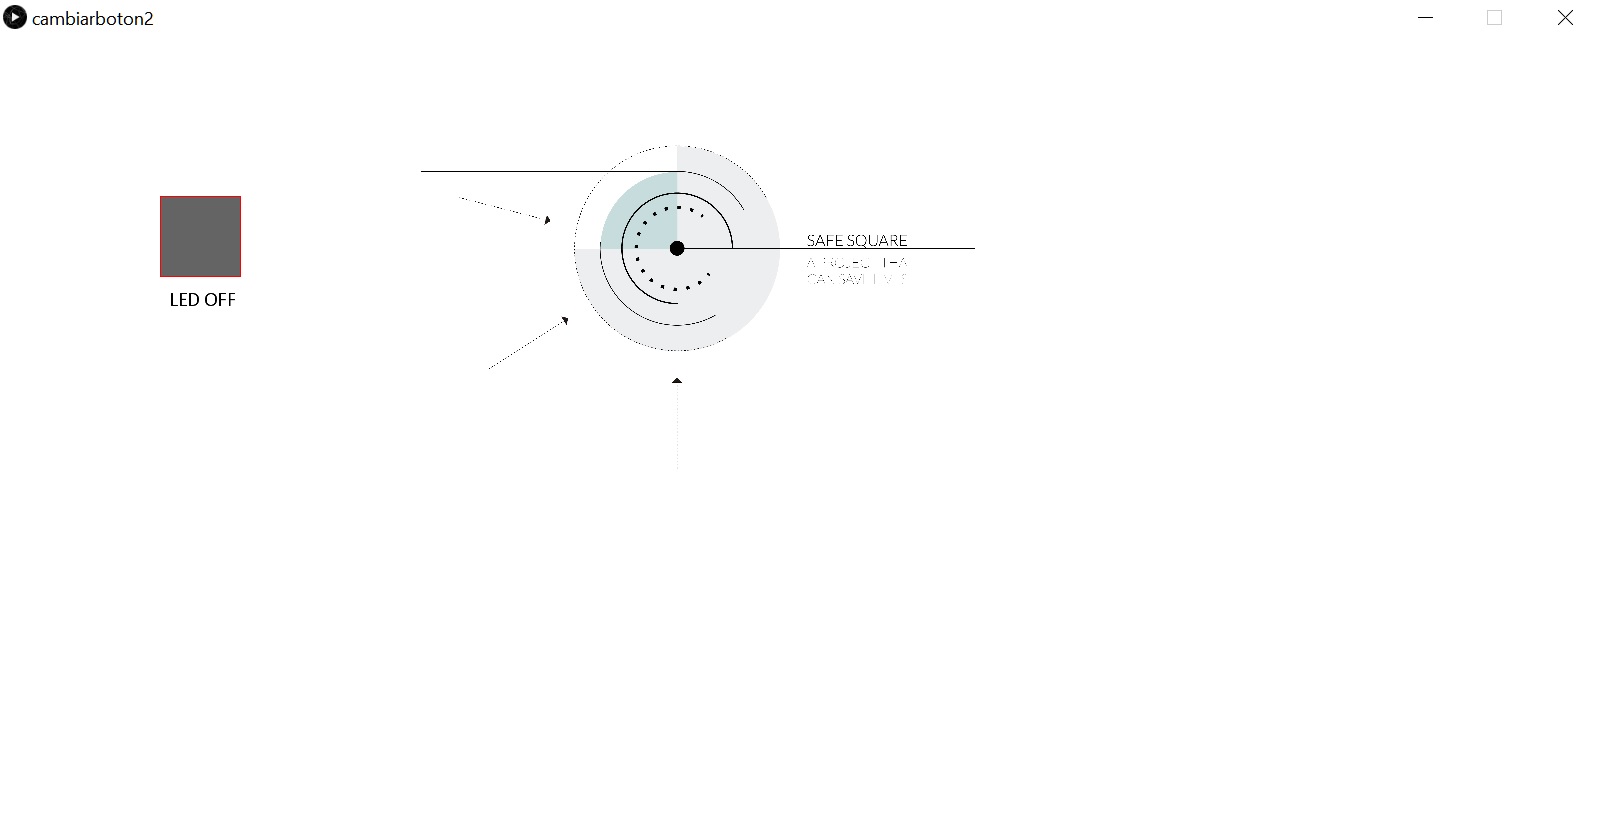
Led is off.
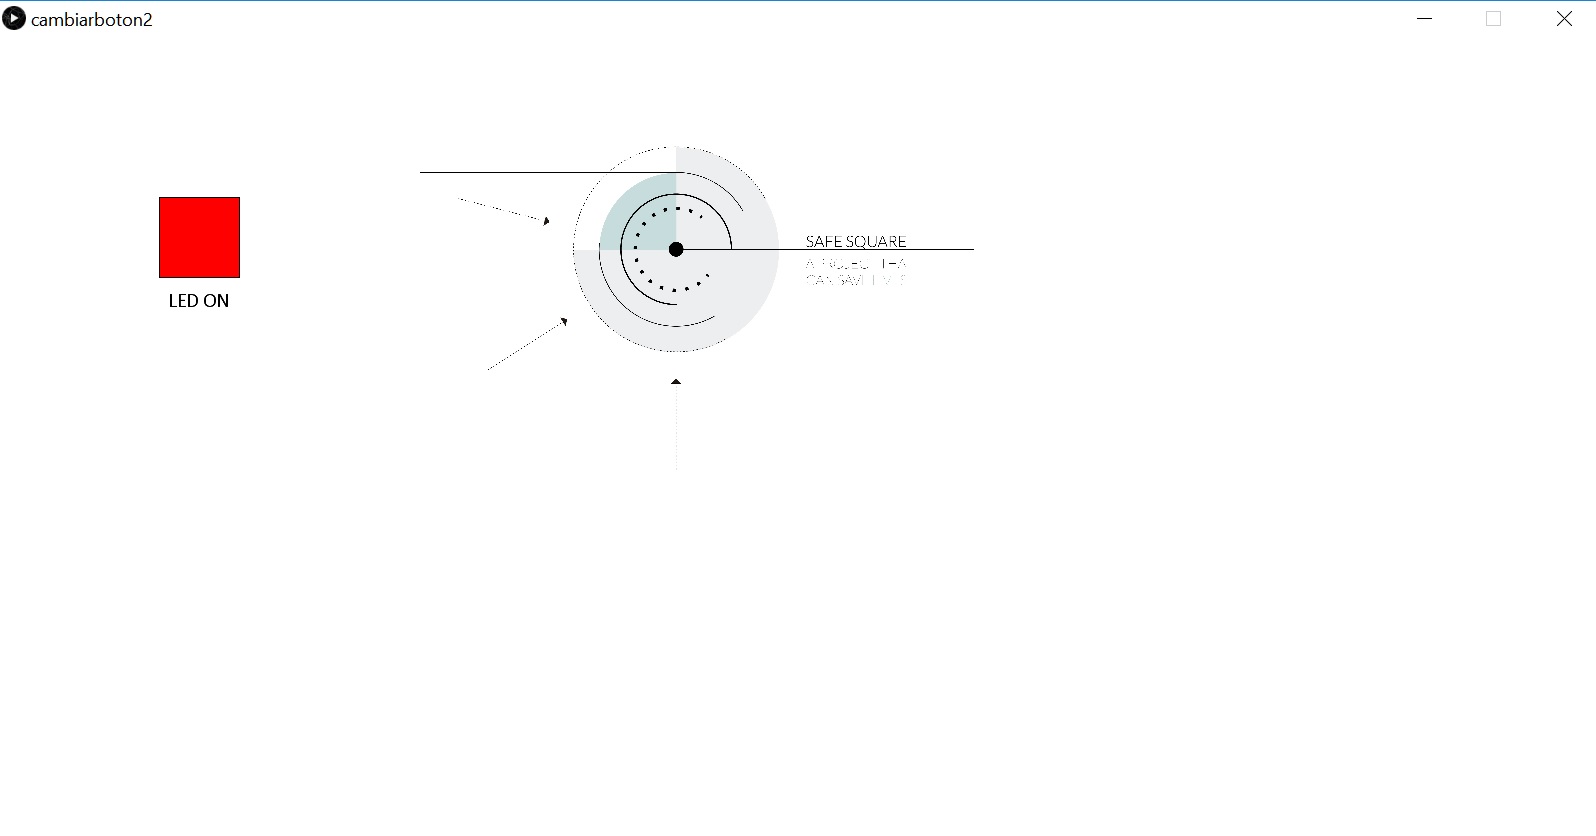
Led is on.
VIDEO:
ARDUINO CODE:
/*
  Blink
  Turns on an LED on for one second, then off for one second, repeatedly.

  Most Arduinos have an on-board LED you can control. On the UNO, MEGA and ZERO
  it is attached to digital pin 13, on MKR1000 on pin 6. LED_BUILTIN is set to
  the correct LED pin independent of which board is used.
  If you want to know what pin the on-board LED is connected to on your Arduino model, check
  the Technical Specs of your board  at https://www.arduino.cc/en/Main/Products

  This example code is in the public domain.

  modified 8 May 2014
  by Scott Fitzgerald

  modified 2 Sep 2016
  by Arturo Guadalupi

  modified 8 Sep 2016
  by Colby Newman
*/


// the setup function runs once when you press reset or power the board
void setup() {
  // initialize digital pin LED_BUILTIN as an output.
  pinMode(13, OUTPUT);
}

// the loop function runs over and over again forever
void loop() {
  digitalWrite(13, HIGH);   // turn the LED on (HIGH is the voltage level)
  delay(1000);                       // wait for a second
  digitalWrite(13, LOW);    // turn the LED off by making the voltage LOW
  delay(1000);                       // wait for a second
}
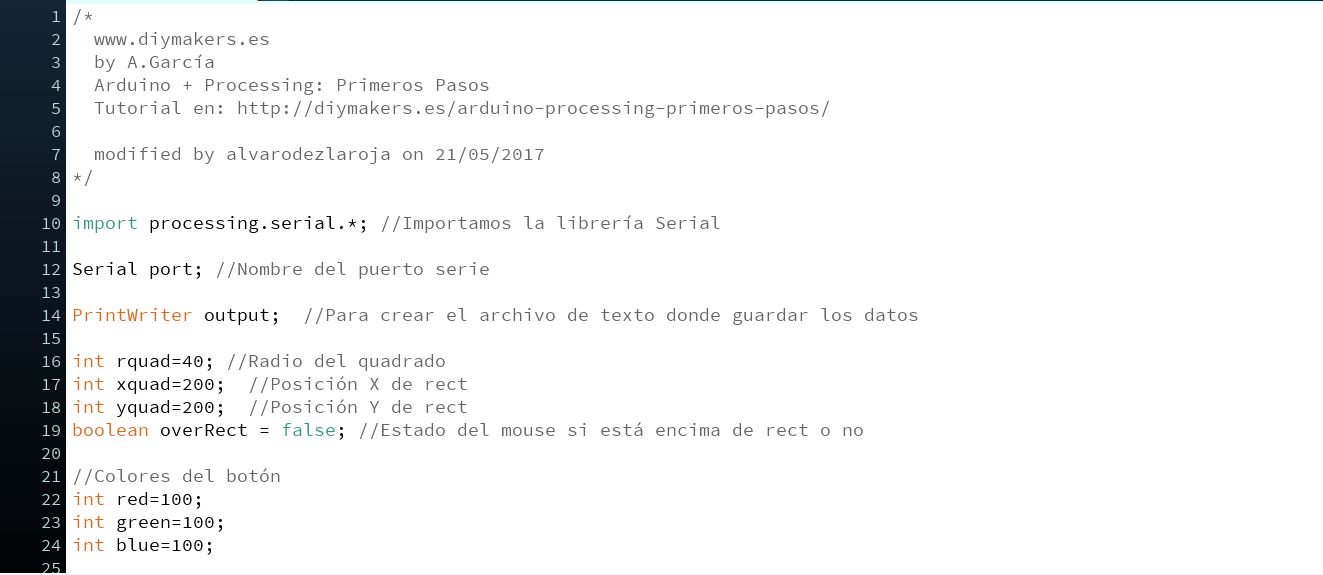
PROCESSING CODE:
/*
www.diymakers.es
by A.García
Arduino + Processing: Primeros Pasos
Tutorial en: http://diymakers.es/arduino-processing-primeros-pasos/
modified by alvarodezlaroja on 21/05/2017
*/
import processing.serial.*; //Importamos la librería Serial
Serial port; //Nombre del puerto serie
PrintWriter output; //Para crear el archivo de texto donde guardar los datos
int rquad=40; //Radio del quadrado
int xquad=200; //Posición X de rect
int yquad=200; //Posición Y de rect
boolean overRect = false; //Estado del mouse si está encima de rect o no
//Colores del botón
int red=100;
int green=100;
int blue=100;
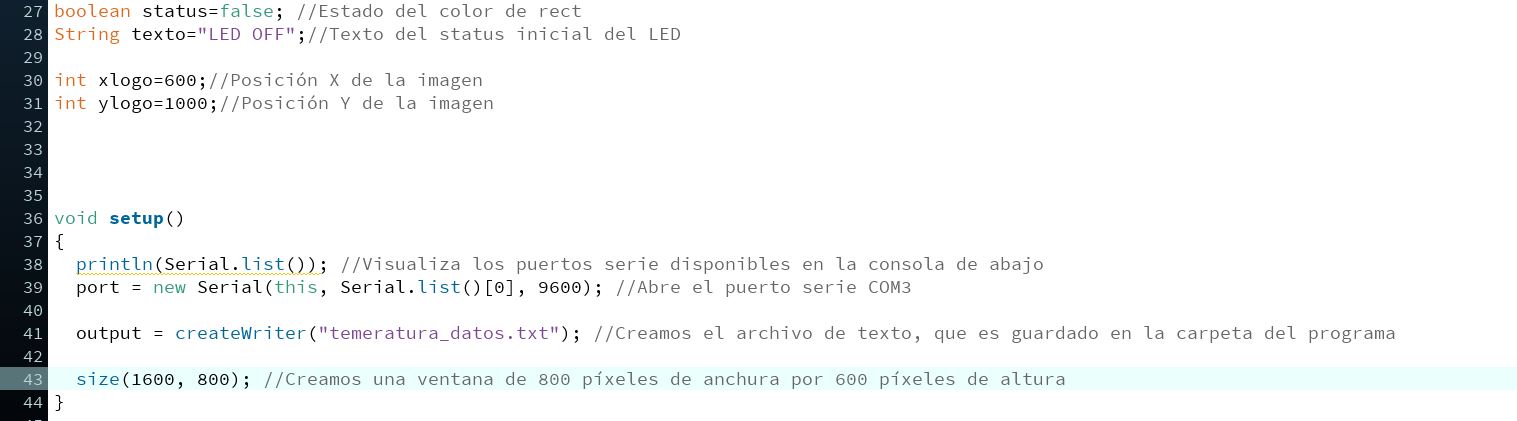
boolean status=false; //Estado del color de rect
String texto="LED OFF";//Texto del status inicial del LED
int xlogo=700;//Posición X de la imagen
int ylogo=250;//Posición Y de la imagen
void setup()
{
println(Serial.list()); //Visualiza los puertos serie disponibles en la consola de abajo
port = new Serial(this, Serial.list()[0], 9600); //Abre el puerto serie COM3
output = createWriter("temeratura_datos.txt"); //Creamos el archivo de texto, que es guardado en la carpeta del programa
size(1600, 800); //Creamos una ventana de 800 píxeles de anchura por 600 píxeles de altura
}
void draw()
{
background(255,255,255);//Fondo de color blanco
if(mouseX > xquad-rquad && mouseX < xquad+rquad && //Si el mouse se encuentra dentro de rect
mouseY > yquad-rquad && mouseY < yquad+rquad)
{
overRect=true; //Variable que demuestra que el mouse esta dentro de rect
stroke(255,0,0); //Contorno de rect rojo
}
else
{
overRect=false; //Si el mouse no está dentro de rect, la variable pasa a ser falsa
stroke(0,0,0); //Contorno de rect negro
}
//Dibujamos un rectangulo de color gris
fill(red,green,blue);
rectMode(RADIUS); //Esta función hace que Width y Height de rect sea el radio (distancia desde el centro hasta un costado).
rect(xquad,yquad,rquad,rquad);
//Creamos un texto de color negro con la palabra LED
fill(0,0,0);
PFont f = loadFont("Calibri-48.vlw");//Tipo de fuente
textFont(f, 20);
text(texto, 170, 270);
//Ponemos la imagen de nuestro logo
imageMode(CENTER);//Esta función hace que las coordenadas de la imagne sean el centro de esta y no la esquina izquierda arriba
PImage imagen=loadImage("logo.jpg");
image(imagen,xlogo,ylogo,600,413);
//Recibir datos temperatura del Arduino
}
void mousePressed() //Cuando el mouse está apretado
{
if (overRect==true) //Si el mouse está dentro de rect
{
status=!status; //El estado del color cambia
port.write("A"); //Envia una "A" para que el Arduino encienda el led
if(status==true)
{
//Color del botón rojo
red=255;
green=0;
blue=0;
texto="LED ON";
}
if(status==false)
{
//Color del botón negro
red=100;
green=100;
blue=100;
texto="LED OFF";
}
}
}
void keyPressed() //Cuando se pulsa una tecla
{
if(key=='w'||key=='W')
{
ylogo--; //El logo se deplaza hacia arriba
}
else if(key=='s'||key=='S')
{
ylogo++; //El logo se deplaza hacia abajo
}
else if(key=='a'||key=='A')
{
xlogo--; //El logo se desplaza hacia la izquierda
}
else if(key=='d'||key=='D')
{
xlogo++; //El logo se desplaca hacia la derecha
}
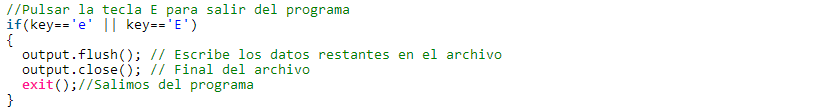
//Pulsar la tecla E para salir del programa
if(key=='e' || key=='E')
{
output.flush(); // Escribe los datos restantes en el archivo
output.close(); // Final del archivo
exit();//Salimos del programa
}
}>
PROBLEMS:
-It has to change the index of Serial.list () [1] by the index corresponding to the serial port that is connected our plate "VERY IMPORTANT IS 1". In the console below you can see the index once the graphical environment has started.
I thought that my processing version it was wrong.
FILES:
test1 arduino
test1processing
3. Make a more advanced interface using an input.
WHAT I AM GOING TO DO?
In this case what I will do is an interface with a graph for my capacitive sensor input, which shows me the values sent by the sensor.
In the exercise of input I made a capacitive sensor, through an output to two analog pins and 2 cables connected to 2 sheets of copper.
The idea is to create a pressure sensor for my final project, which collects the approximate vehicle weight to activate the Output,
I have not yet been able to create a program for the pressure sensor
But I have been able to create another program that detects when you touch the copper plates and during the time you do it analogically, the program is the following in arduino:
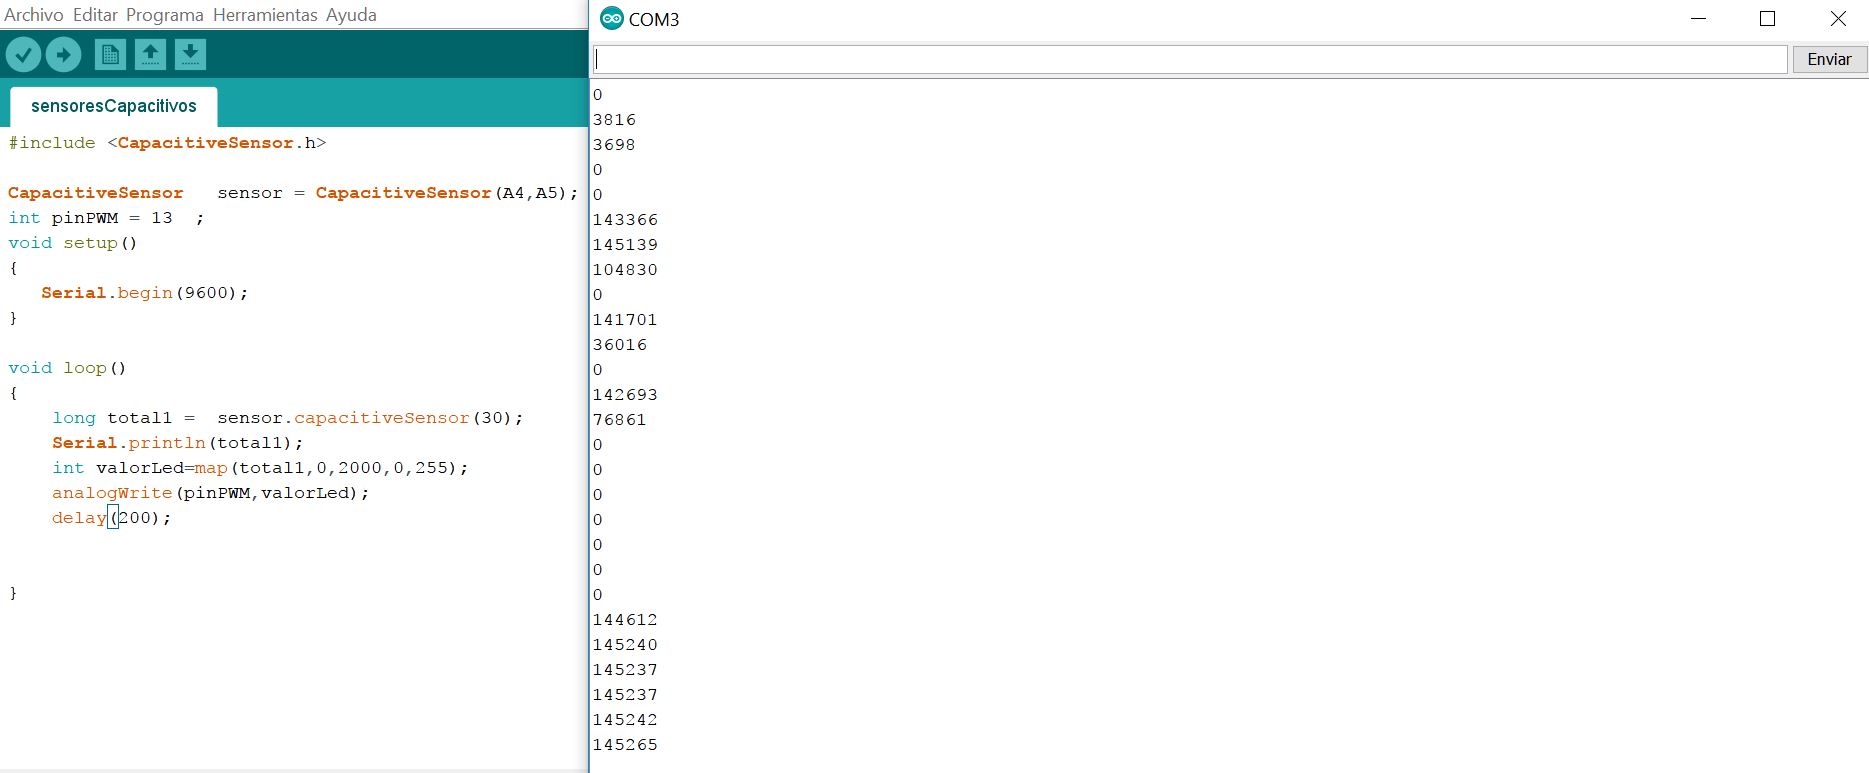
Monitor serial and code of my input.
Analog write and Pin PWM causes the led of the board to light more or less intensity according to the value entered.
Long capacitive sensor measures current in digital pins a4-a5.
Serial println sends the numeric value to the serial monitor.
Delay is the time that happens from each loop so we can adjust the time for the sensor.
I got most of the information to make graphs from the following web tutorial:
Processing, I visualized a tutorial in which they perform a temperature and humidity control using a dht11 sensor,
from this example I will use that graph to read my plate, and values that communicate with the graph.
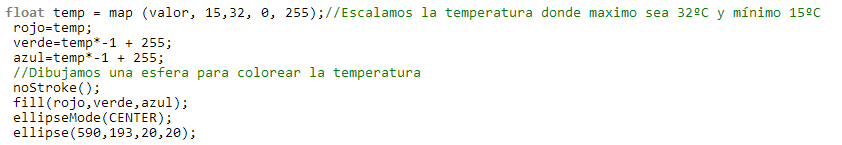
It will also have to adjust the measures to change them from the temperature to the reading of the serial
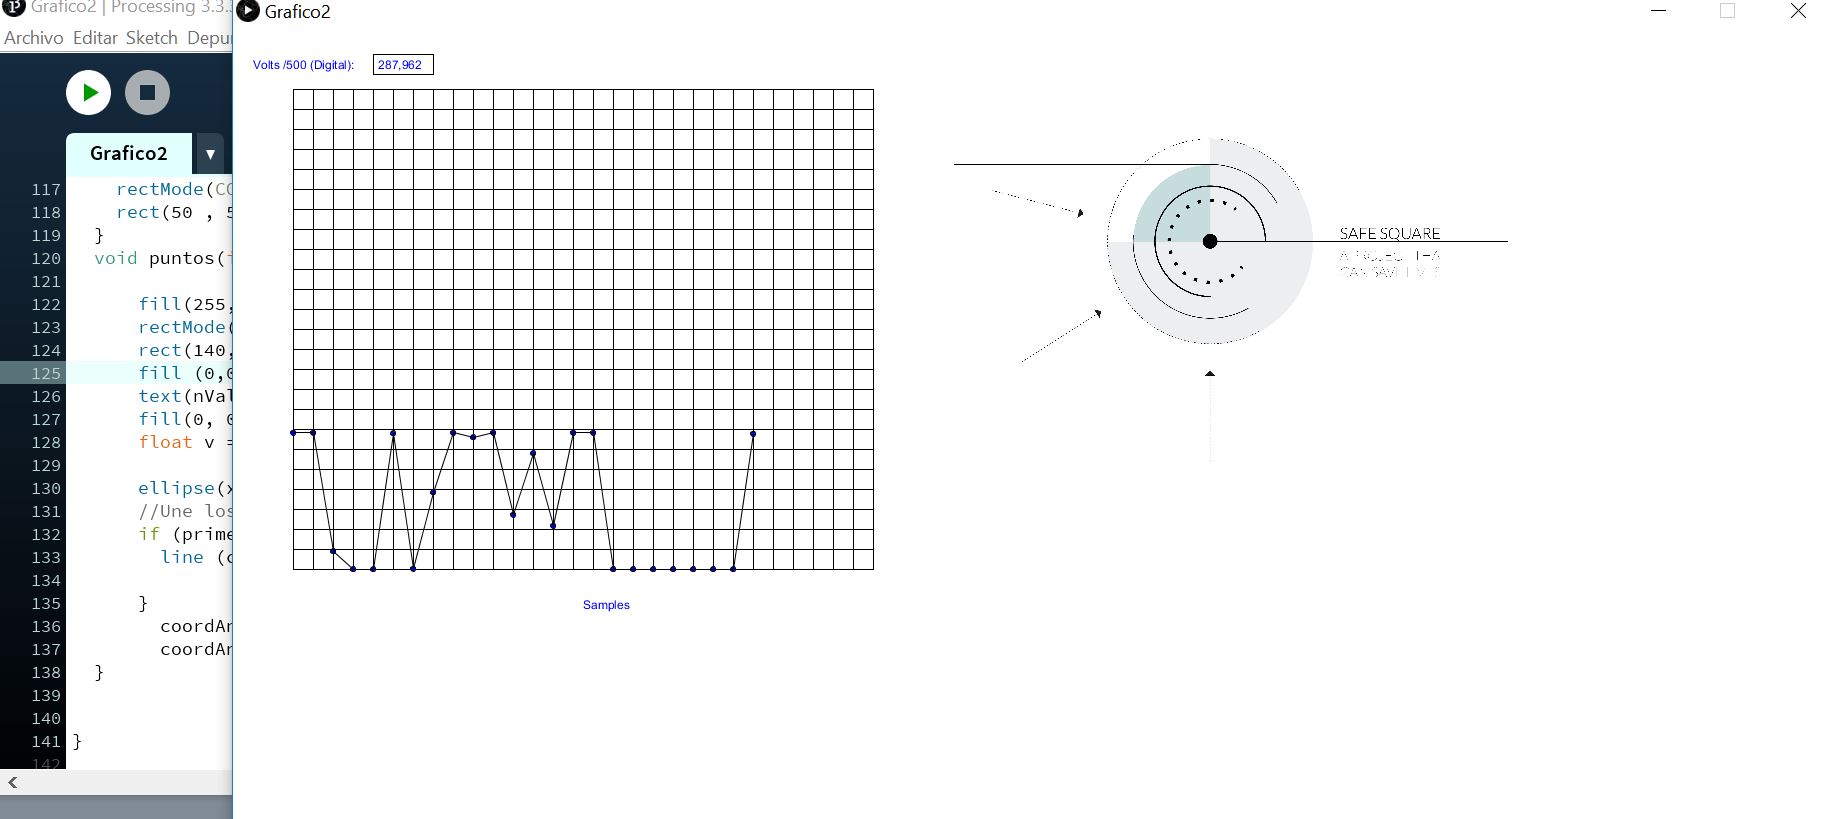
Graphs of my sensor in processing.
CODE:
import processing.serial.*;

int x = 65, ancho = 700, alto = 600;
boolean p = true;
int cFondo = 255; //Color fondo
int xlogo=1000;//Posición X de la imagen
int ylogo=250;//Posición Y de la imagen

PrintWriter datos;
Serial puertoArduino;
Graf g = new Graf(ancho, alto, cFondo);


void setup (){

  size(1600, 1000);
  background(cFondo);
  print(Serial.list());
  //ojo el '0' de Serial.list()[0]
  //se cambia por el orden de numero de puerto de tu ordenador

  puertoArduino = new Serial(this, Serial.list()[0], 9600);

// Guardaremos los datos muestreados en un archivo de texto,
// asi podremos analizarlos con una hoja de calculo y otro programa.

  datos = createWriter("medidas.txt");
  fill(0, 0, 255);
  text("Volts /500 (Digital): ", 20, 40);
  text("Samples", ancho / 2, alto - 20);
  g.cuadricula();

}

void draw(){

  //Ponemos la imagen de nuestro logo
  imageMode(CENTER);//Esta función hace que las coordenadas de la imagne sean el centro de esta y no la esquina izquierda arriba
  PImage imagen=loadImage("logo.jpg");
  image(imagen,xlogo,ylogo,600,413);

  String inString = puertoArduino.readStringUntil('\n');
   if (inString != null){
      inString = trim(inString);
      float val = float(inString);
      datos.print(val/500 + "\n"); // copia el dato en medidas.txt
      g.puntos(x, val/500, p);
      p = false;
      x = x + 20;
      if (x > ancho - 60) {x = 60;
         g.borra();
         g.cuadricula();
         p = true;


       }
    }
}

void keyPressed() //Cuando se pulsa una tecla
{
  if(key=='w'||key=='W')
  {
        ylogo--; //El logo se deplaza hacia arriba
  }
  else if(key=='s'||key=='S')
  {
        ylogo++; //El logo se deplaza hacia abajo
  }
  else if(key=='a'||key=='A')
  {
        xlogo--; //El logo se desplaza hacia la izquierda
  }
  else if(key=='d'||key=='D')
  {
        xlogo++; //El logo se desplaca hacia la derecha
  }
  //Pulsar la tecla E para salir del programa
  if(key=='e' || key=='E')
  {
    datos.flush(); // Escribe los datos restantes en el archivo
    datos.close(); // Final del archivo
    exit();//Salimos del programa
  }
}


/*
Tildes omitidas en los comentarios.
Graf.pde
*/

class Graf {

  int nX, nY, colF;
  float coordAntX, coordAntY;
  Graf (int x, int y, int cF){
    nX = x;
    nY = y;
    colF  = cF;
  }
  void cuadricula(){
    stroke(0);
    for (int  j = 60 ; j <= nX - 60; j = j + 20){
      line (j, 60, j, nY - 60);      } // Vert
    for (int  j = 60 ; j <= nY - 60; j = j + 20){
      line (60, j, nX - 60, j);} // Horiz

  }

  void borra(){
    fill(colF); // Color del fondo
    noStroke();
    rectMode(CORNERS);
    rect(50 , 50, nX , nY - 30 );
  }
  void puntos(int x, float nValor, boolean primera){

      fill(255,255,255);
      rectMode(CORNERS);
      rect(140,25,200,45);//Borra lectura anterior
      fill (0,0,255);
      text(nValor, 142, 40);
      fill(0, 0, 255);
      float v = map(nValor, 0, 1023, nY - 60, 60); //Mapeo inverso entre
                                                   //los margenes sup e inf.
      ellipse(x, v, 5, 5);
      //Une los dos puntos con una linea excepto en la primera lectura.
      if (primera == false){
        line (coordAntX, coordAntY, x, v);

      }
        coordAntX = x;
        coordAntY = v;
  }


}
PROBLEMS:
I have not managed to use the input as I want, I have to investigate more to make it a pressure sensor similar to Neil's hellotxrx,
I have solved it for this assignment by creating a different program.
It has been difficult to get the graph to be what I want and the values that come out of the monitor in series are adapted to the graph,
I have achieved it through operations and changing the variable VAL
One idea was for the LED to increase and decrease the current according to
the current received by the pins, but the pin 13 on which the LED is is not pwm, which only turns on and off but does not change the brightness.
FILES:
Arduino Capacitive
Processing Graph
Monitor serial and code of my input.
i had to adjust again the serial information from my sensor to be visible on the graphs
VIDEO:
ARDUINO CODE:
/* Programmed by Alvarolaroja 23/05/2017 traduced from Neil G. in C Hello TxRx */

#include <avr/io.h>
#include <util/delay.h>


static uint16_t up,down;
static uint16_t arriba, abajo;

void setup() {
  // pinMode(A3, OUTPUT);
  DDRC |= (1 << PC3);
  PORTC &= (~(1 << PC3));
  Serial.begin(9600);

  ADMUX =  (0 << REFS1) | (0 << REFS0) | (0 << ADLAR) | (0 << MUX3) | (0 << MUX2) | (1 << MUX1) | (0 << MUX0);//PC2 input
  ADCSRA = (1 << ADEN) | (1 << ADPS2) | (1 << ADPS1) | (1 << ADPS0);//prescaler 128
}

void loop() {
      up = 0;
      down = 0;
      for (int count = 0; count < 100; ++count) {
        _delay_us(100);
        PORTC |= (1 << PC3);
        //digitalWrite(A3,1);
        //arriba = analogRead(A2);
        ADCSRA |= (1 << ADSC);
        while (ADCSRA & (1 << ADSC)){
            ;}
        //up += arriba;
        up += ADC;
        //mySerial.println(up);

        _delay_us(100);
        PORTC &= (~(1 << PC3));
        //digitalWrite(A3,0);
        //abajo = analogRead(A2);
        ADCSRA |= (1 << ADSC);
        while (ADCSRA & (1 << ADSC)){
            ;}
        down += ADC;
        //down += abajo;
if ((up-down)<15000)
    {
      Serial.println(up-down);
      Serial.println('5');
      _delay_ms(10);

      // Enviamos 'L' por el puerto serie (TX)

    }
    else
    {

 Serial.println(up-down);
Serial.println('8');


    }


         }
/*Serial.println(up-down);

     _delay_ms(10);*/
   /*
      Serial.write(1);
      _delay_ms(10);
      Serial.write(2);
      _delay_ms(10);
      Serial.write(3);
      _delay_ms(10);
      Serial.write(4);

      Serial.write((up & 255));
      _delay_ms(10);
      Serial.write(((up >> 8) & 255));
      _delay_ms(10);
      Serial.write((down & 255));
      _delay_ms(10);
      Serial.write(((down >> 8) & 255));
      _delay_ms(10);*/
}
PROCESSING CODE:
import processing.serial.*;
int x = 65, ancho = 700, alto = 600;
boolean p = true;
int cFondo = 255; //Color fondo
int xlogo=1000;//Posición X de la imagen
int ylogo=250;//Posición Y de la imagen
PrintWriter datos;
Serial puertoArduino;
Graf g = new Graf(ancho, alto, cFondo);
void setup (){
size(800, 800);
background(cFondo);
print(Serial.list());
//ojo el '0' de Serial.list()[0]
//se cambia por el orden de numero de puerto de tu ordenador
puertoArduino = new Serial(this, Serial.list()[0], 9600);
// Guardaremos los datos muestreados en un archivo de texto,
// asi podremos analizarlos con una hoja de calculo y otro programa.
datos = createWriter("medidas.txt");
fill(0, 0, 255);
text("Volts (Digital): ", 20, 40);
text("Samples", ancho / 2, alto - 20);
g.cuadricula();
}
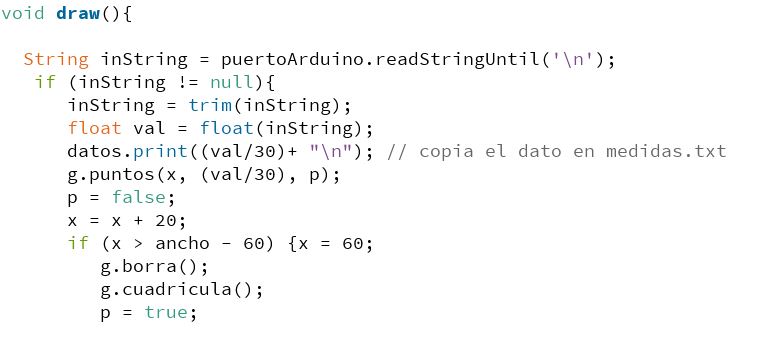
void draw(){
String inString = puertoArduino.readStringUntil('\n');
if (inString != null){
inString = trim(inString);
float val = float(inString);
datos.print((val/30)+ "\n"); // copia el dato en medidas.txt
g.puntos(x, (val/30), p);
p = false;
x = x + 20;
if (x > ancho - 60) {x = 60;
g.borra();
g.cuadricula();
p = true;
}
}
}
void keyPressed() //Cuando se pulsa una tecla
{
datos.flush(); // Escribe los datos restantes en el archivo
datos.close(); // Final del archivo
exit();//Salimos del programa
}
/*
Tildes omitidas en los comentarios.
Graf.pde
*/
class Graf {
int nX, nY, colF;
float coordAntX, coordAntY;
Graf (int x, int y, int cF){
nX = x;
nY = y;
colF = cF;
}
void cuadricula(){
stroke(0);
for (int j = 60 ; j <= nX - 60; j = j + 20){
line (j, 60, j, nY - 60); } // Vert
for (int j = 60 ; j <= nY - 60; j = j + 20){
line (60, j, nX - 60, j);} // Horiz
}
void borra(){
fill(colF); // Color del fondo
noStroke();
rectMode(CORNERS);
rect(50 , 50, nX , nY - 30 );
}
void puntos(int x, float nValor, boolean primera){
fill(255,255,255);
rectMode(CORNERS);
rect(140,25,200,45);//Borra lectura anterior
fill (0,0,255);
text(nValor, 142, 40);
fill(0, 0, 255);
float v = map(nValor, 0, 1023, nY - 60, 60); //Mapeo inverso entre
//los margenes sup e inf.
ellipse(x, v, 5, 5);
//Une los dos puntos con una linea excepto en la primera lectura.
if (primera == false){
line (coordAntX, coordAntY, x, v);
}
coordAntX = x;
coordAntY = v;
}
}
FILES:
Arduino inputsensor
Processing graph4
4. Try to view sensor from python.
I've been experimenting with Python how I could visualize my pressure sensor in the same way that I visualized it in your videos.
To try another type of program I will take the Neil file, hellotxrx45.py and I will modify it to make the interface look different.
I experimented without knowing practically anything to see if my sensor worked, after trying and making some errors I got to visualize the values.