WARNING!!! This webpage is following a different template than the rest of the assignment as I need a blank html page to embed the processing design here below
Assignements
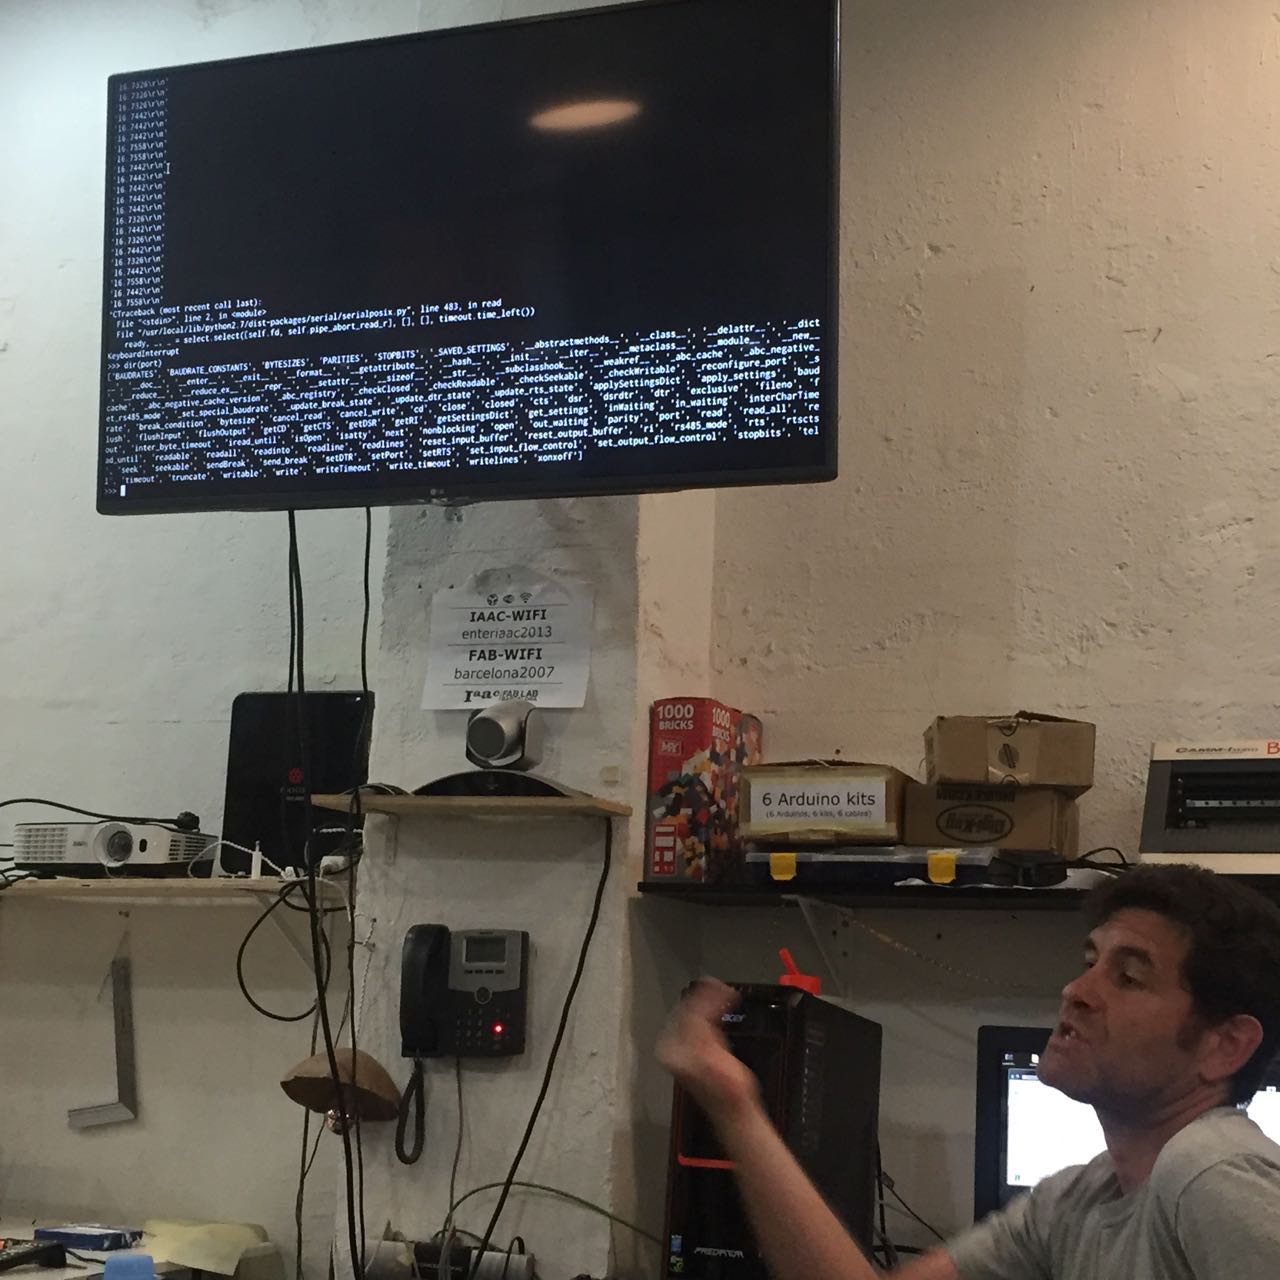
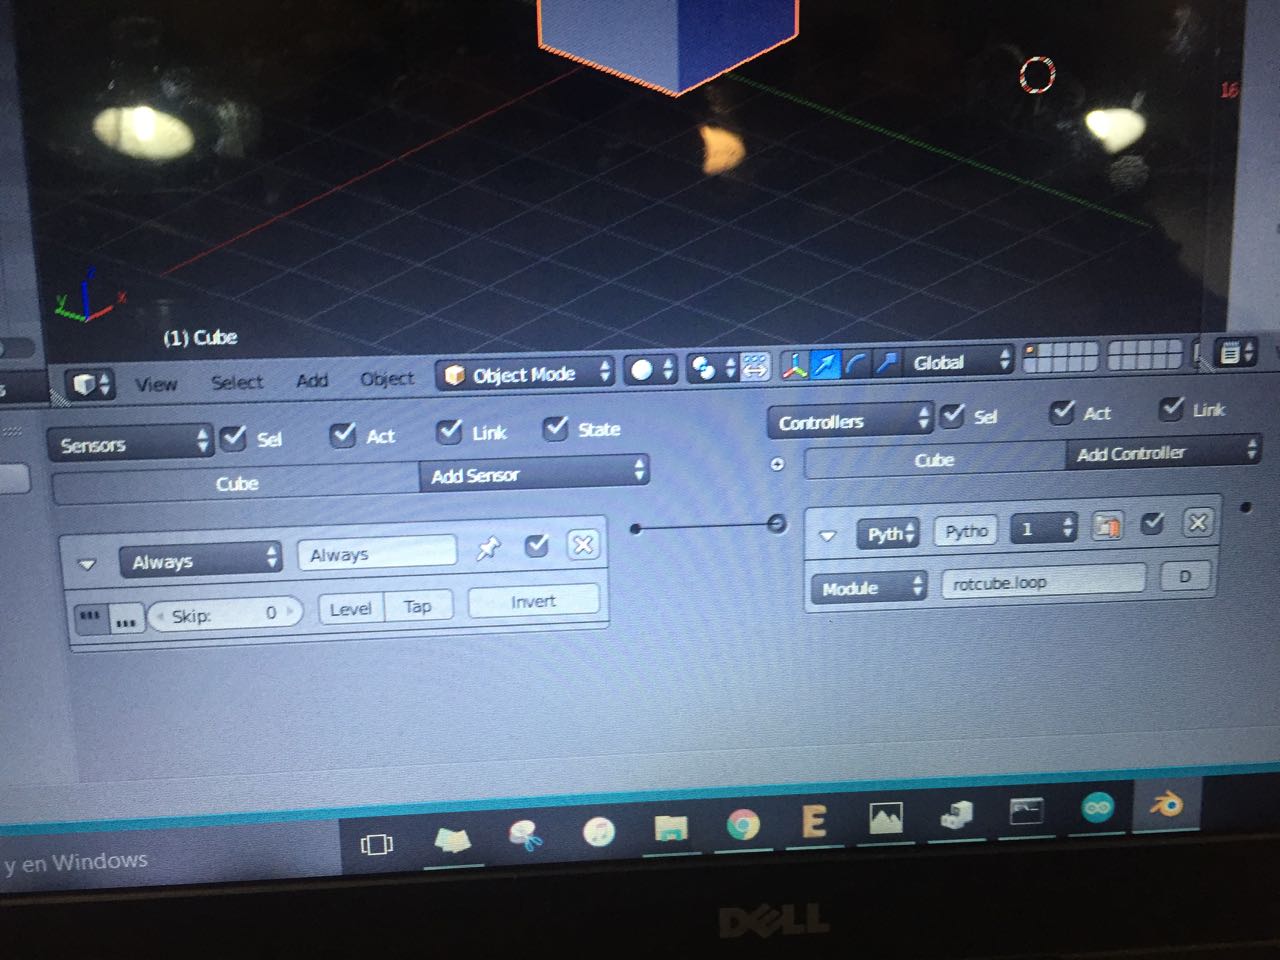
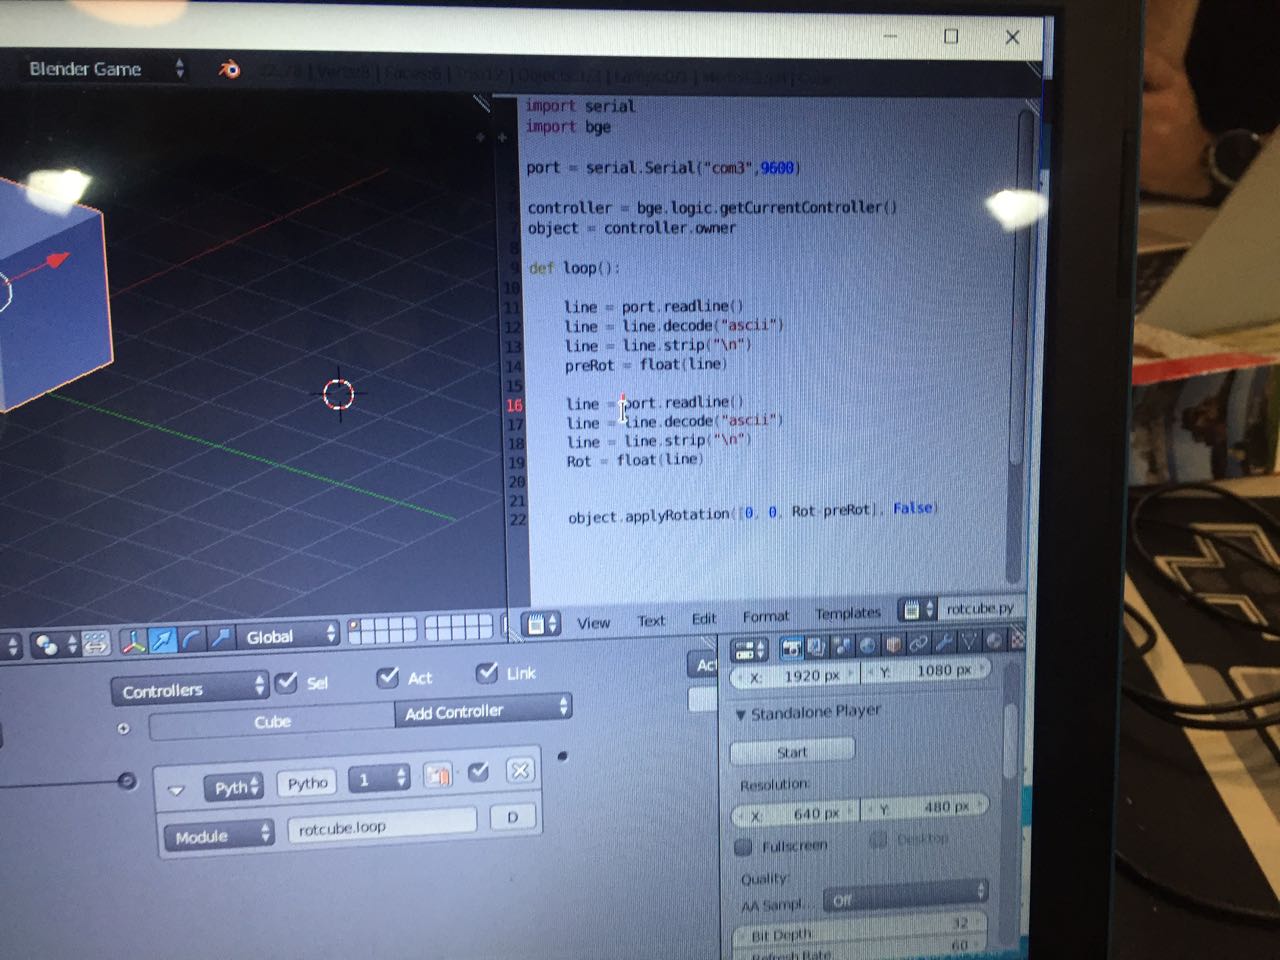
Feedback: This is really fun to see sensor data (from an arduino) being displayed on your screen thanks a script in procesing. I attempted to do the same in the software Blender thanks to a class we got but this was unfortunately too complex for me to produce.
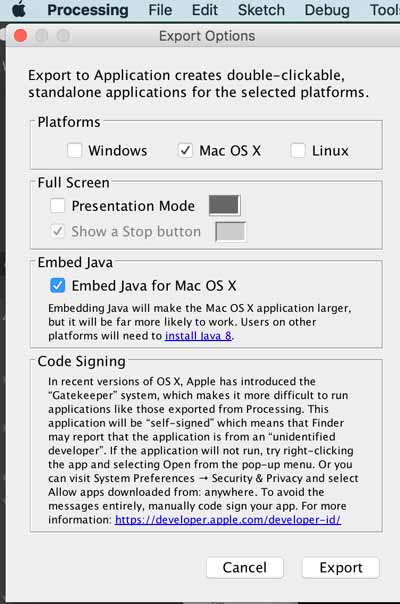
To achieve this, i followed a well explained tutorial that you can find here. Below are the main steps I followed
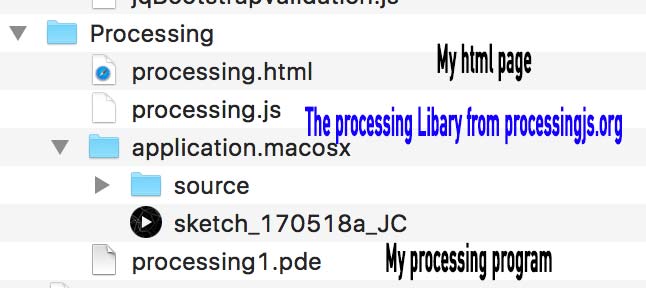
<script type="text/javascript" src="processing.js"></script>
<canvas data-processing-sources="myProgram.pde"></canvas>
<style type="text/css"> pre { background-color: #EEE; padding: 15px; } #theCanvas { width: 500px; margin: auto; border: 5px solid black; display: block; } ></style type="text/css">
If you are planning on using external artwork you will need to upload your assets to your website along with your PDE source code file. Then add the following "preloader" directive at the top of your sketch as a comment - this will tell ProcessingJS to have the files available when your sketch begins running.
/* @pjs preload="file1.png","file2.png","file3.jgp"; */
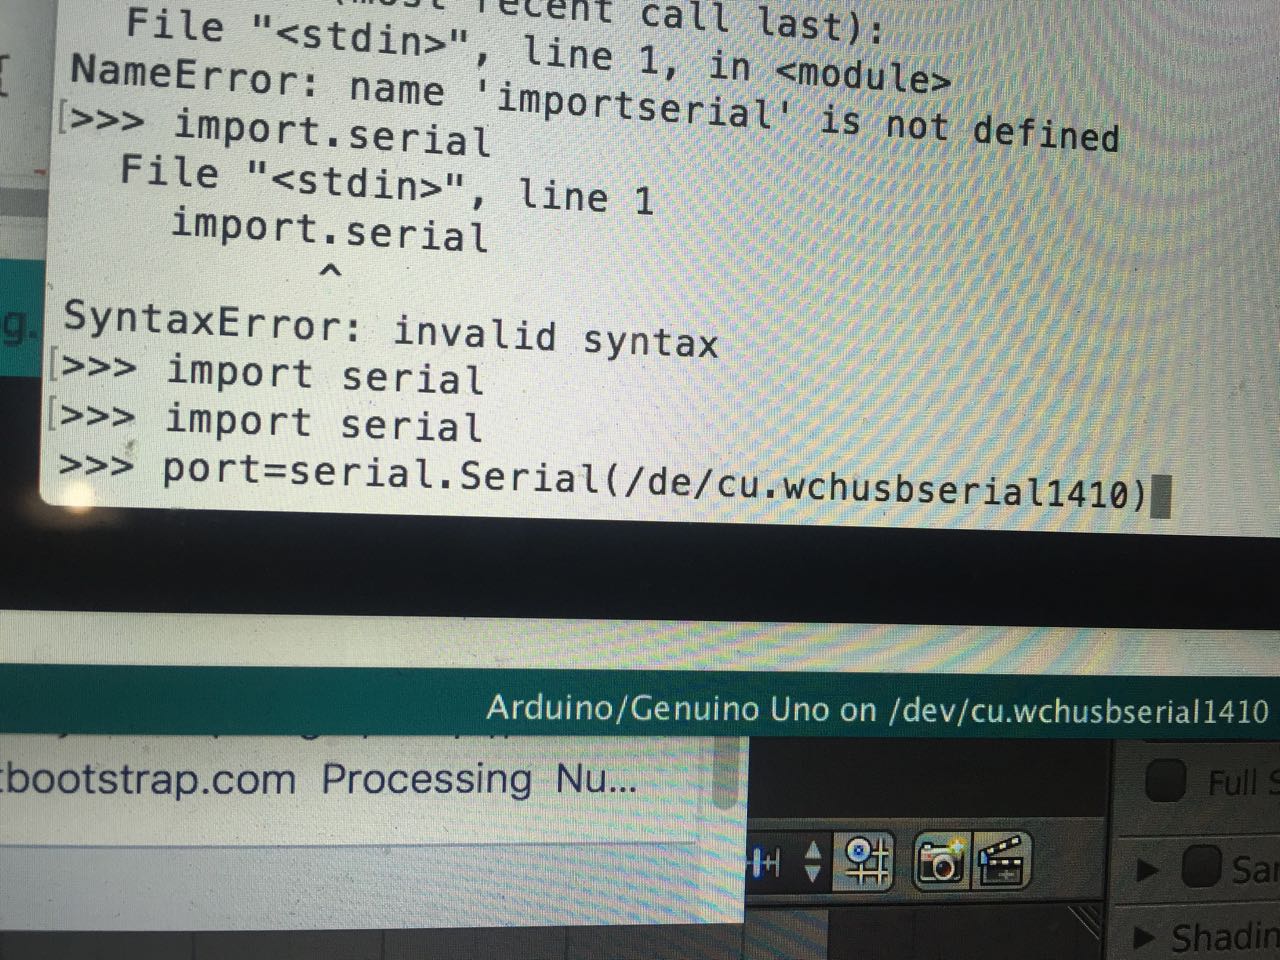
I wanted to get the data from the pressure sensor I was working on with Arduino (Pee-ometer) project. Here are the steps I followed:
Note that to make the readind of the data in Arduino more easy to read, I used rolling average rather that raw sensor data, to avoid the value display changing too frequently.

We had in class a tutorial of Processing, which helped me further understand how the graphical representation in processing was working. I was not able to create a whole new sketch on my own (I only modified an existing one). For my final project I will look into creating a sketch in Processing because it represents data beautifully, and can commmunicate 2 ways with Arduino (Make a light blink for instance if touching a button on a a screen
The imporant part in processing is to ensure it gets the data you are sending from Arduino. In My case, those are 3 lines of code in the processing script