Exercise 16 Interface and Application Programming
Requirement
- write an application that interfaces with an input &/or output device that you made,
- comparing as many tool options as possible
Introduction
So far we have been making quite a few boards in the past 5 months. For this week, I will be working on the thermistor, which is the input board I made in week 11. I would have loved to write an application programme for the phototransistor as well, but there was problem with the phototransistor board I made. I believe the board was short-circuited over time. So I tried doing a reflow, and in the course of that, the copper pad under the phototransistor fell out, rendering the board useless. I didn't have time to re-mill the board so I can only make do with using the thermistor board.
Tkinter
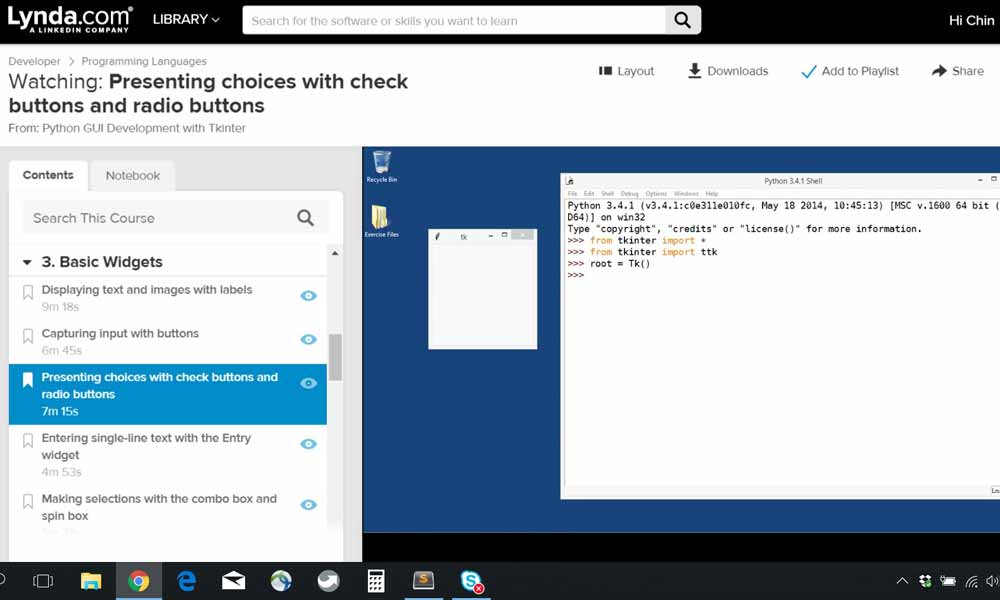
Tkinter: I spent Thursday and Friday watching a Lydia tutorial, entitled "Python GUI Development with Tkinter", which greatly helped my learning of the syntax of Tkinter. Because the tutorial was conducted in Python 3, I have upgraded my Python 2.7 to 3.4. Minor syntax change applies.
Tkinter is a popular cross-platform, open-source scripting language/GUI widget, and is the only GUI packaged with Python itself. It is included in the Python Windows Installers of Python 3. To check if tkinter is properly installed on your system, execute the following: "python -m tkinter" from the command line; this should open a window demonstrating a simple Tk interface.
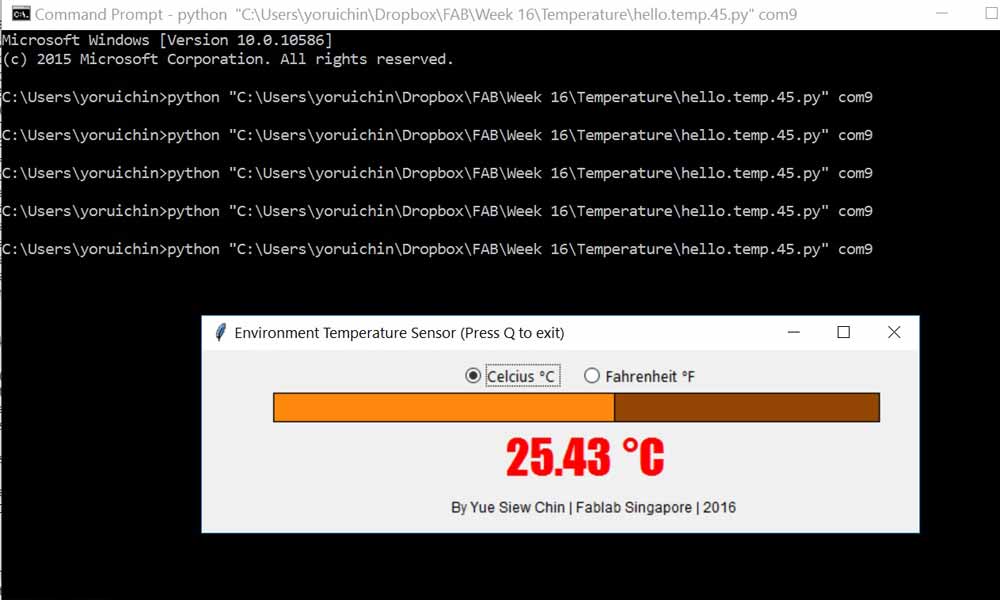
I modified the class python codes that display temperature on a GUI bar. I was using IDLE and/or sublime text as the platform for writing the codes.
Some of the main additions are listed below: Libraries to include:
  from tkinter import *    // in Python 2, use capital T in "from Tkinter import *"
  from numpy import log
  from tkinter import ttk
  import serial
I added 2 variable to hold celcius and Fahrenheit values, and call a function to check my radio button selection.
   ctemp = filter
   ftemp = (ctemp*9.0)/5.0+32  # Celcius to Fahrenheit
   display_temp()
def display_temp():
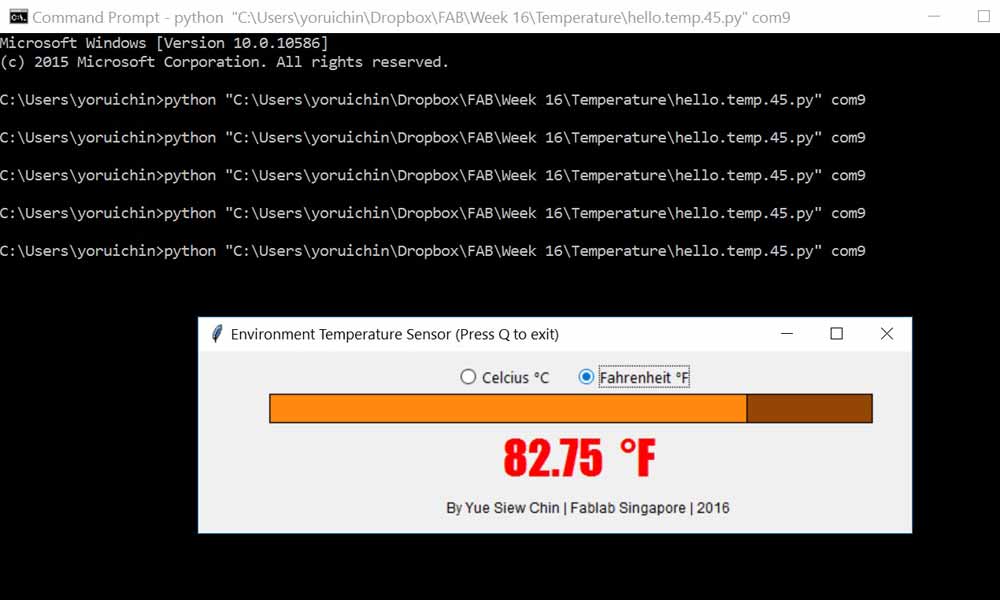
if rbVar.get() == 2: # display Fahrenheit
text2 = "°F"
canvas.itemconfigure("text2",text="%s"%text2)
canvas.itemconfigure("text",text="%.2f"%ftemp)
else: # display Celcius
text2 = "°C"
canvas.itemconfigure("text2",text="%s"%text2)
canvas.itemconfigure("text",text="%.2f"%ctemp)
Radio buttons to be placed on the canvas
    rb1 = ttk.Radiobutton(root, text='Celcius °C ', variable=rbVar, value=1, command=display_temp).place(x=220,y=10)
    rb2 = ttk.Radiobutton(root, text='Fahrenheit °F', variable=rbVar, value=2, command=display_temp).place(x=320,y=10)
matplotlib
matplotlib: I used another 1.5 days trying to understand matplotlib and how to plot a graph from live data. The website and youtube tutorial by Paul McWhorter has been most helpful to explain some of the concepts and purposes behind the syntaxes of matplotlib.
matplotlib is a python 2D plotting library which produces publication quality figures in a variety of hardcopy formats and interactive environments across platforms. To install matplotlib, I will execute "pip install matplotlib" at command prompt. I will also need drawnow, which can be installed by executing "pip install drawnow" at command prompt. I was using IDLE and/or sublime text as the platform for writing the codes.


The codes are as follows:
import matplotlib.pyplot as plt
from numpy import log
from drawnow import *
import serial
#plt.ion() # interactive mode to plot live data
tempV=[]
filter = 0.0
eps = 0.5
cnt = 0
SerialData = serial.Serial('COM9',9600)
def makeGraph(): # a function that makes desire plot
plt.ylim(22,32) # y axis limiter
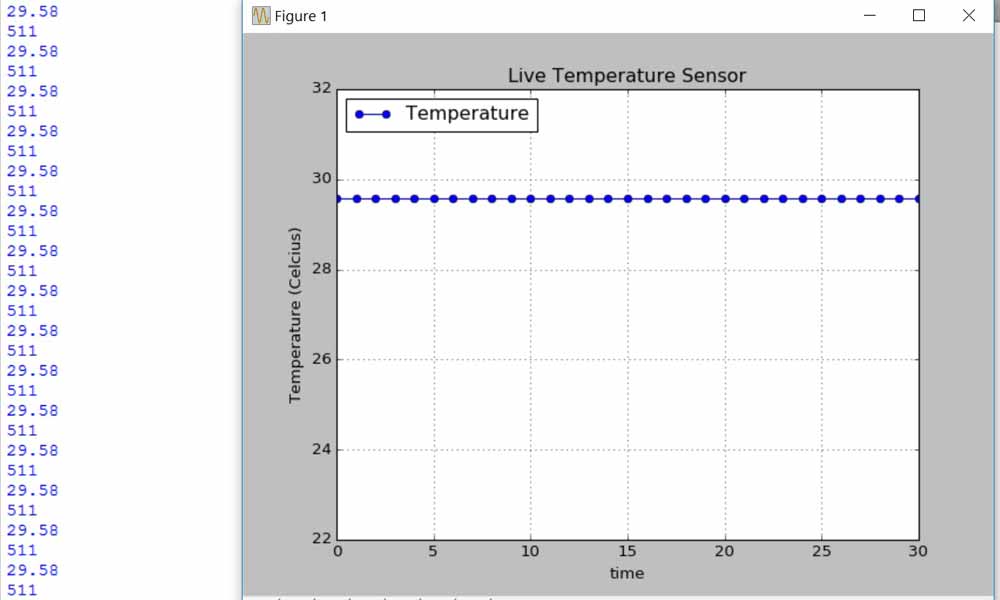
plt.title('Live Temperature Sensor')
plt.grid(True)
plt.ylabel('Temperature (Celcius)')
plt.xlabel('time')
plt.plot(tempV, "bo-", label='Temperature') # blue round dot
plt.legend(loc='upper left')
while True:
byte2 = 0
byte3 = 0
byte4 = 0
SerialData.flush()
while 1:
#
# find framing
#
byte1 = byte2
byte2 = byte3
byte3 = byte4
byte4 = ord(SerialData.read())
if ((byte1 == 1) & (byte2 == 2) & (byte3 == 3) & (byte4 == 4)):
break
low = ord(SerialData.read())
high = ord(SerialData.read())
print(low)
print(high)
value = 256*high + low
if (value > 511):
value -= 1024 # value = value - 1024
V = 2.5 - value*5.0/(20.0*512.0) # Voltage out (Vo) = R / (R + 10K) * Vcc = 2.5
R = 10000.0/(5.0/V-1.0)
B = 3950.0
R25 = 10000.0
T = 1.0/(log(R/R25)/B+(1/(25.0+273.15))) - 273.15
filter = (1-eps)*filter + eps*T
temp = float(filter)
tempV.append("%.2f" % temp) # Build our array by appending temperature readings
print("%.2f" % temp)
drawnow(makeGraph) # call drawnow to draw live graph
plt.pause (.0001)
cnt=cnt+1
if(cnt>30): # delete the first item from the array
tempV.pop(0) # this allows us to just see the last 30 data points
Problems encountered
As for matplotlib, the outcome of the plotting is not returning the values which I was expecting. I couldn't understand what went wrong with my codes and why the serial input was not able to respond according to the temperature change. I spent 2 days troubleshooting this problem and was not able to solve it. The serial data generated from the hello.temp.45.py changes in response to temperature. But when I run the display_temperature.py, the serial data was "consistent" and does not respond to temperature change. Since everything on the board was constant (I didn't even change the c code on the microcontroller), the problem must have to do with the python coding of my matplotlib programme. 2nd half of the youtube video records the problem with the data.

Reflections
I really enjoyed this week's assignment because programming engaged my mind throughout the entire week, as I was thinking through the syntax and logic of the codes. It was fun exploring new languages and greatly satisfying when the programme was able to perform in the way I wanted it to. (And it can be rather frustrating, trying over and over again, just to get it right).
Download work files
References
- PYTHON GUI PROGRAMMING TKINTER
- Python and Tkinter Programming by John E. Grayson
- An Introduction to Tkinter by David Beazley
- Tkinter 8.5 reference: aGUI for Python by John W. Shipman
- Tkinter – GUIs in Python
- TCK TK
- An introduction to GUI programming with Tkinter by Erik Spence
- Python with Arduino LESSON 11: Plotting and Graphing Live Data from Arduino with Matplotlib
- NTC Thermistors (Data sheet)
- Using a Thermistor
- What Is An NTC Thermistor
- Temperature Measurements with Thermistors: How-To Guide
- NTC Type SMD by Erik Spence
- An introduction to GUI programming with Tkinter
- Kelvin to Celsius formula