This
week’s assignment was to use a previous week’s
circuit board and write and or modify existing code to output some
reading from
the micro controller. For
the week on input
devices I used a Hall
Effect sensor.
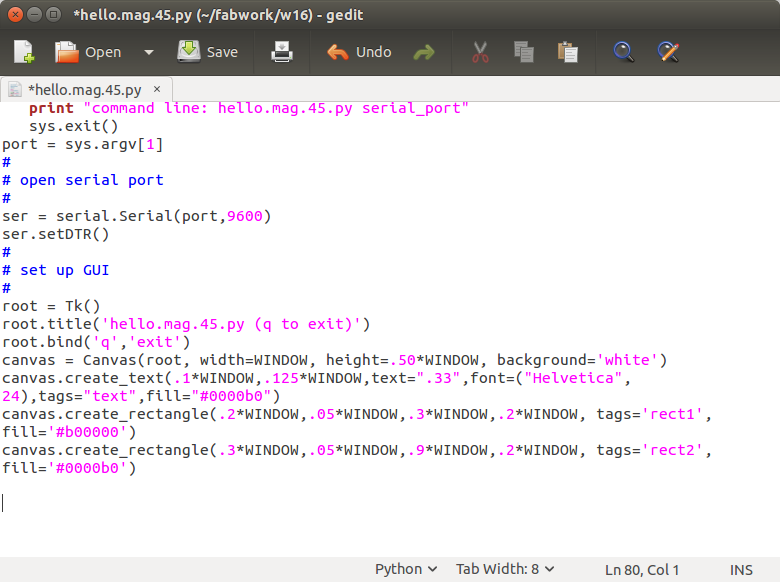
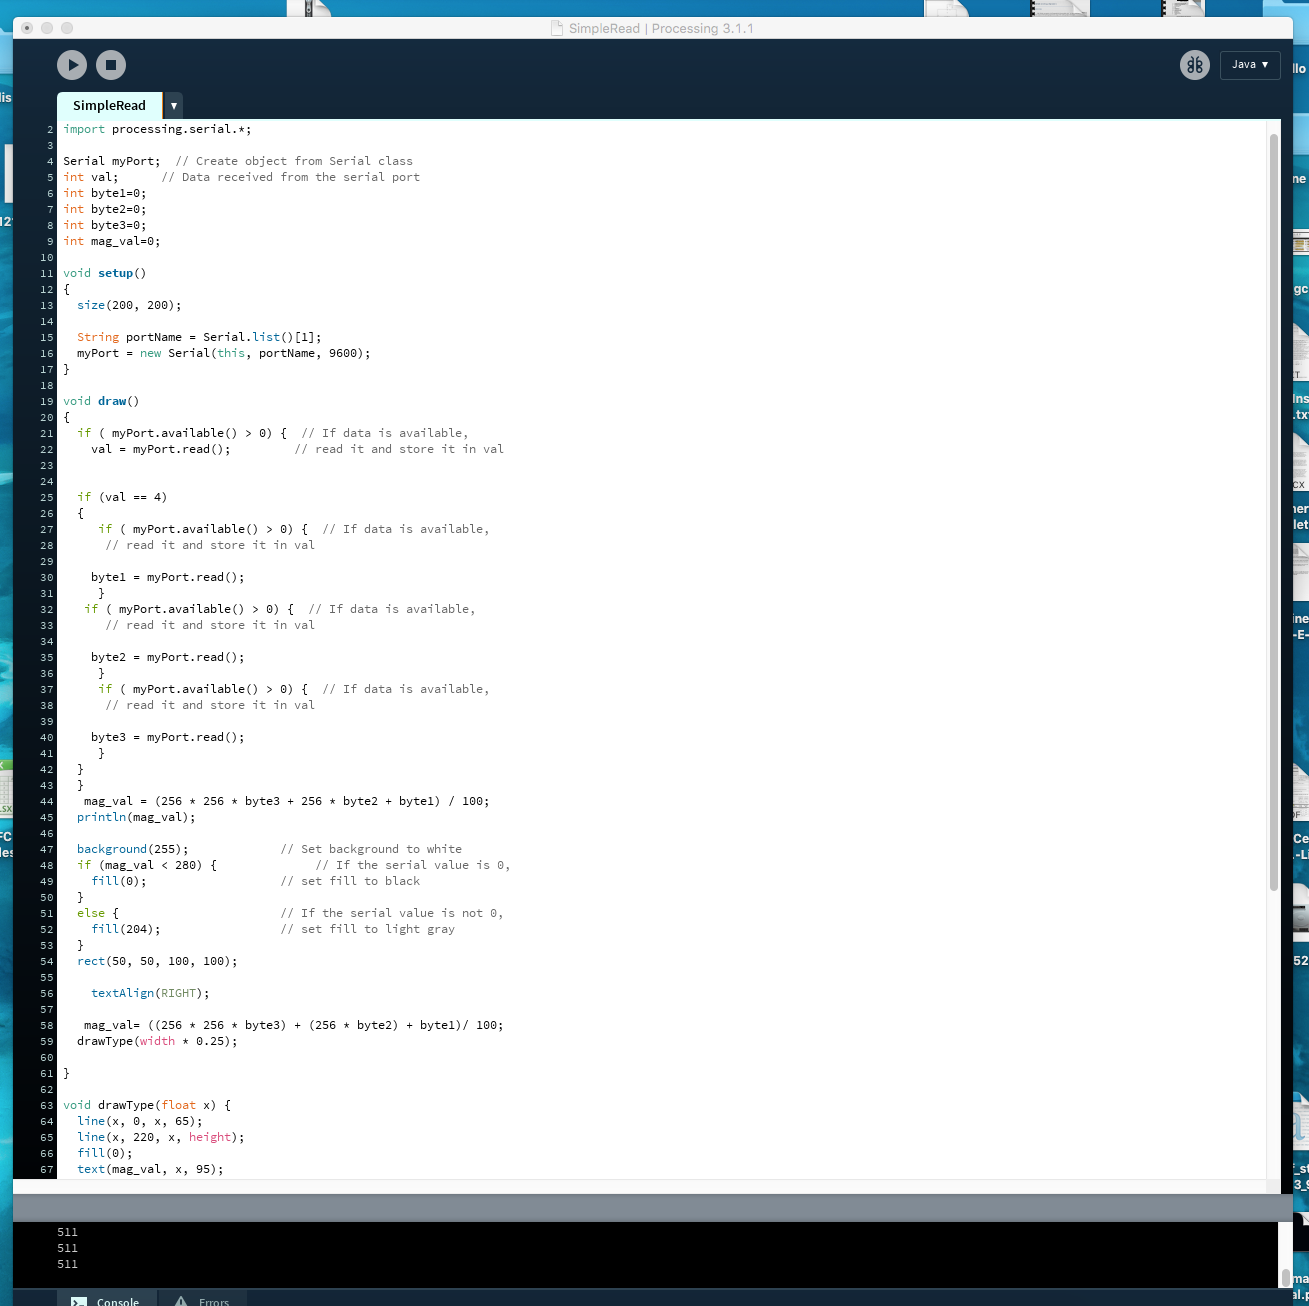
To start out I looked at the python code that Neil provide for that week and tried to change a few small things first. The code that was given uses serial reads to get the data. The framing was setup in the micro controller and uses the FDTI cable to interface with the computer. The initial part of the code I was going to change is the color of the rectangles that represent the value of the data. The line of code that says canvas.create_ rectangle, at the end of the parameter list there is a fill equals the color. It currently is in red green blue (RGB) formate but can also use some standard colors like red of green.
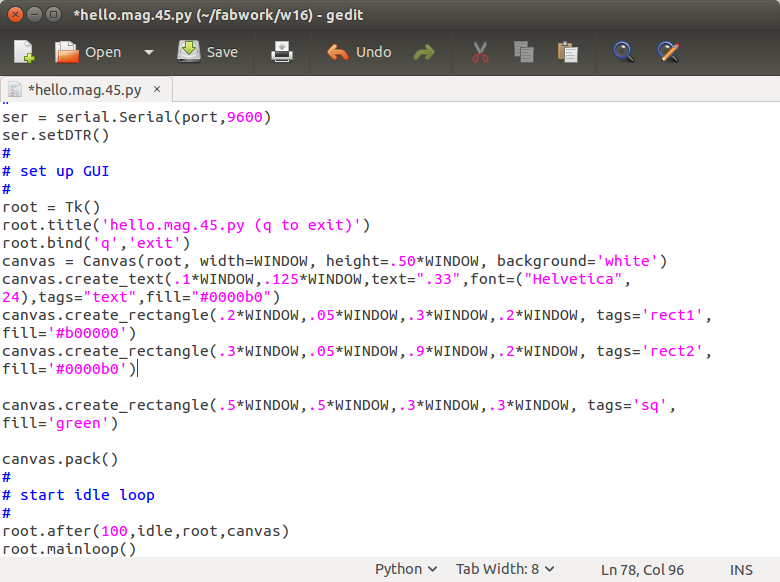
Now that I found out how to change color I wanted to add a square that changed from green to red based on a certain value. The first step was to figure out how to add another shape to the window. To create another shape I used the canvas.create_ rectangle and moved the location and size of the shape to make a square. I initially just tried to put the square on the canvas and make it green. It took a few tries to get it in the right location and size.
1 |
# |
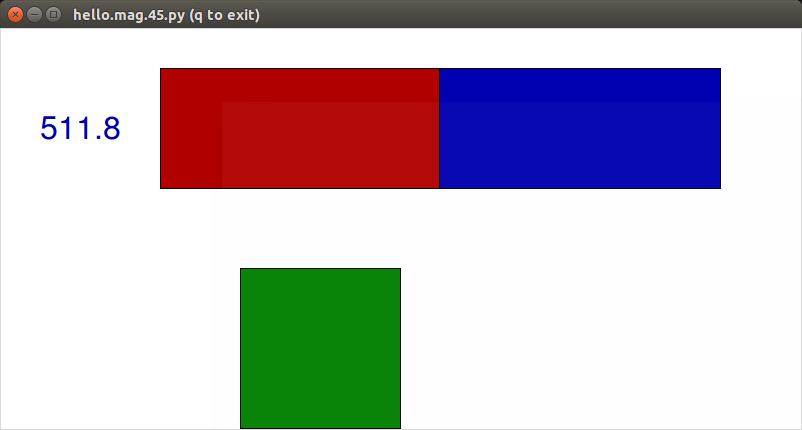
The next step is what I really wanted to do. I wanted to read the value form the sensor and once it reached a certain level in this case I used 270 it would change the square to red.
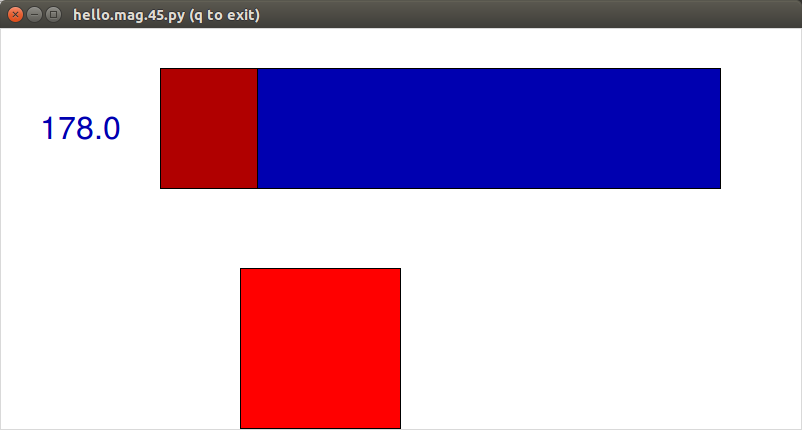
Creating a square that can change color is great if you would like to monitor your device and have critical level warnings with it.
Week 16 from chris rohal on Vimeo.
w16 new from chris rohal on Vimeo.