Reading temperature with Lab View
In this experiment, it is posible to read a temperature sensor and show in an application on a personal computer the curve graphically.
Needed:
- Labview software
- National Instruments Visa Controller
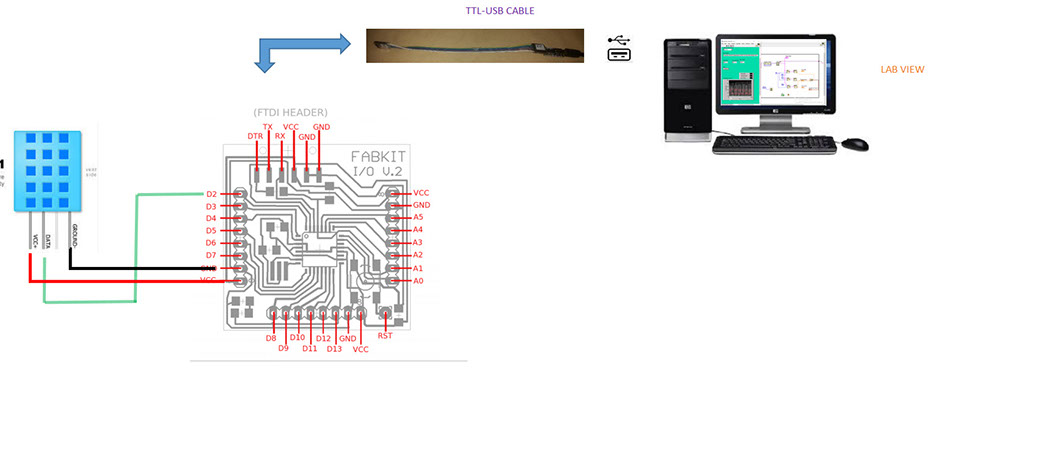
- Arduino or similar (Faduino, etc)
- Arduino IDE
- Temperature Sensor.
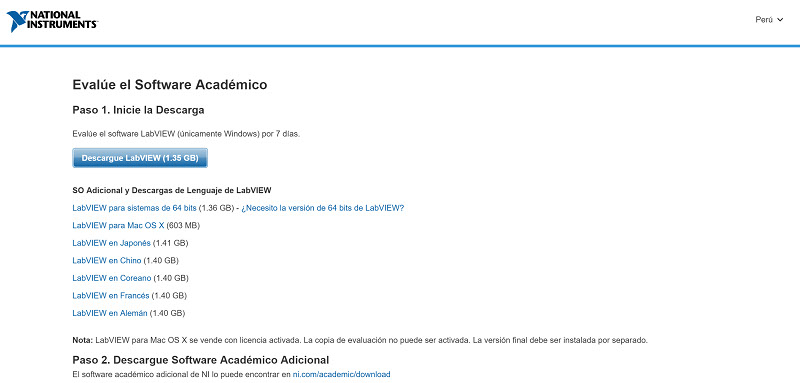
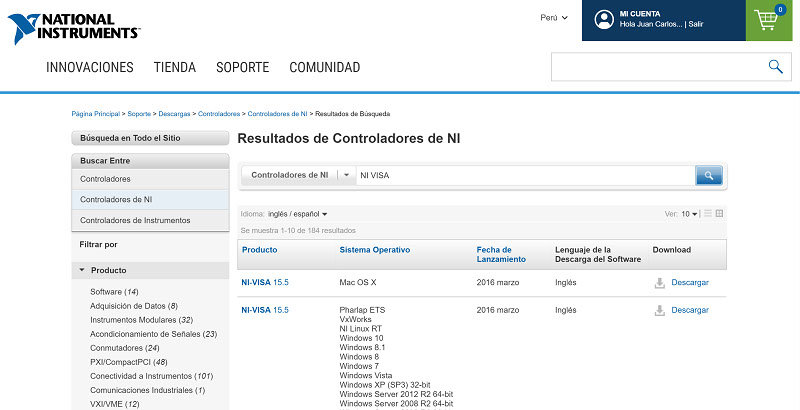
Download Software
Download Labview and NI VISA software.
The pages to download are the following
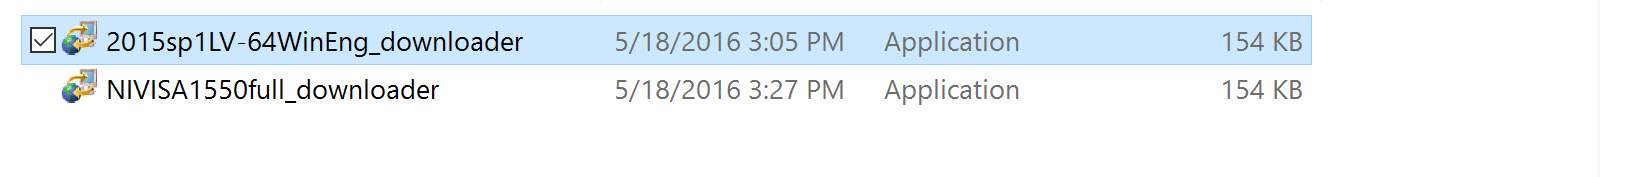
Buiding the model in Lab View
Notice that what is downloading first is the downloader tool.
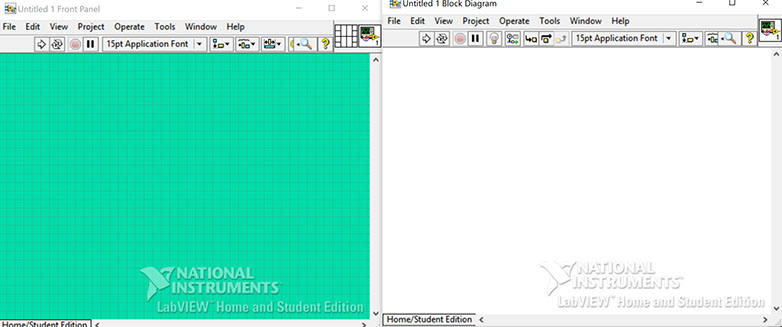
Once installed, Open LabView. You can see the Front Panel and the Block Diagram
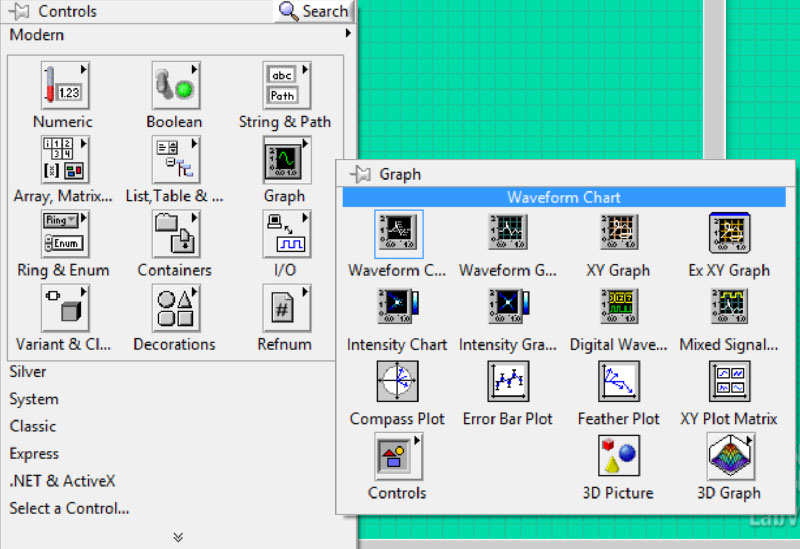
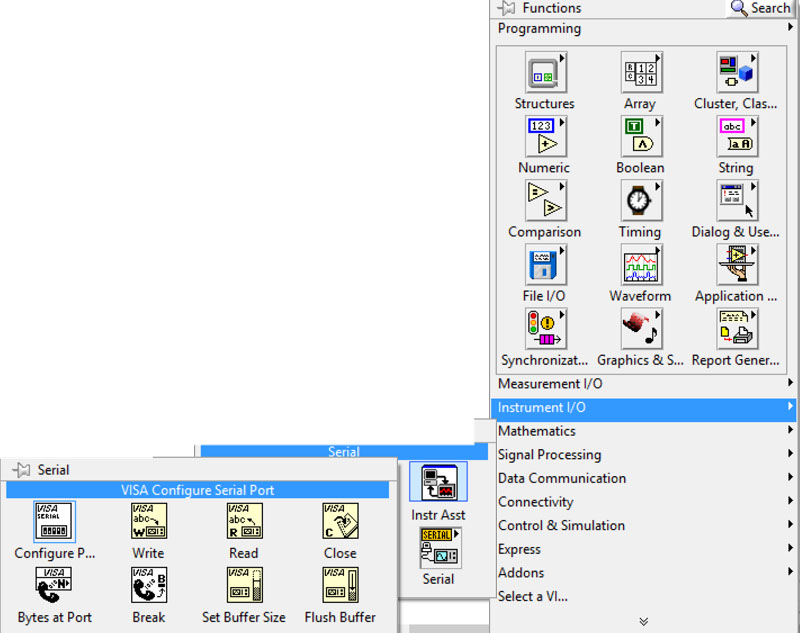
Press Right clik on Front Panel, or go to the menu View / Controls Palette, the Controls Palette will appear. The controls panel contains the objects (controls) you can insert in the Front Panel
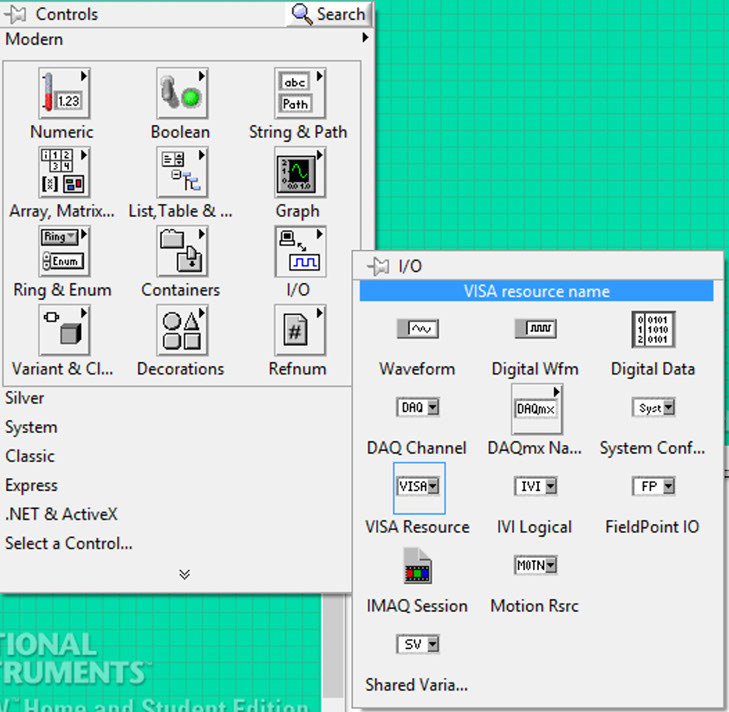
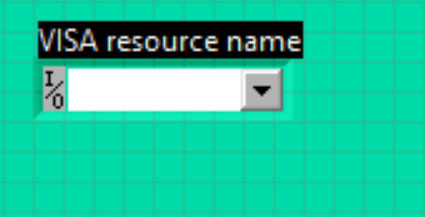
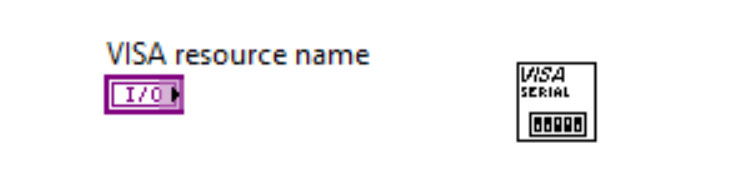
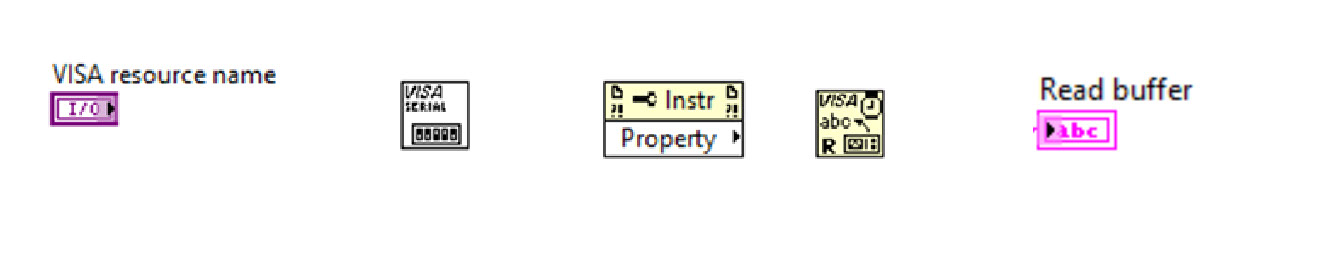
Chose the VISA Resource. This element will be placed on the Front Panel
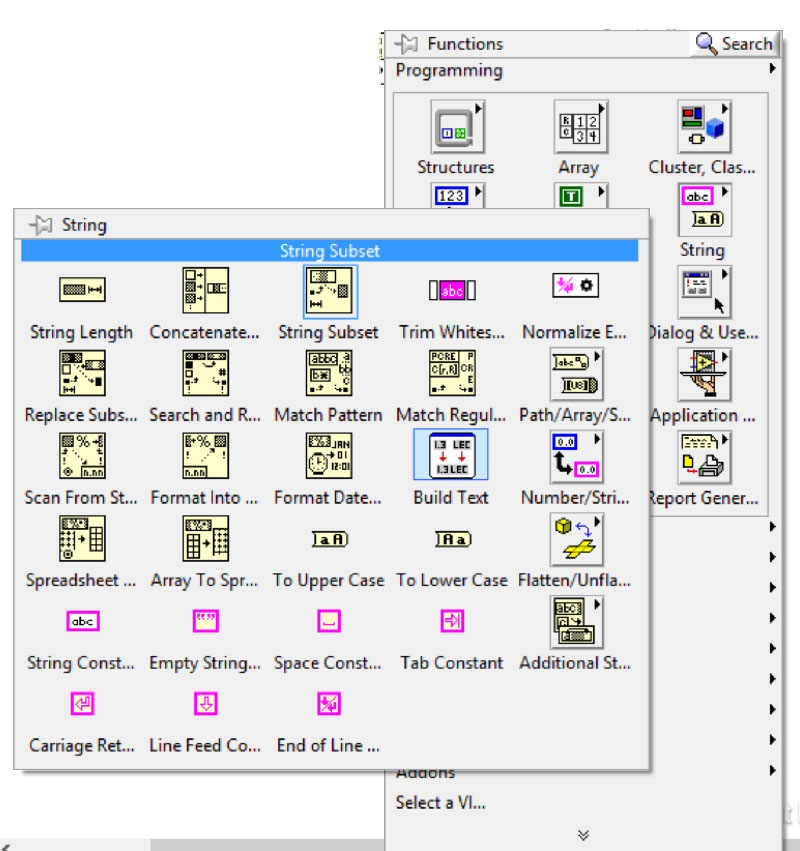
In the Controls Pallette, choose String path / String Indicator
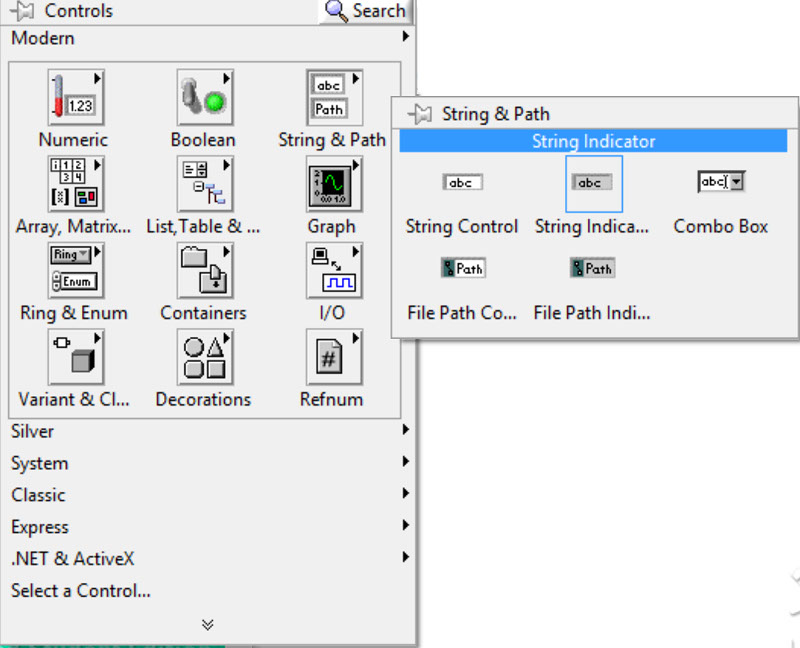
This element will be placed on the Front Panel
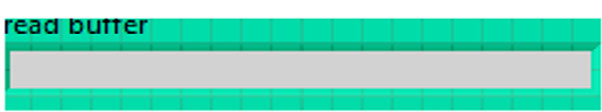
Change the name by read buffer
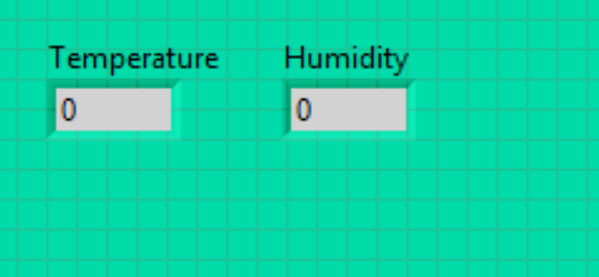
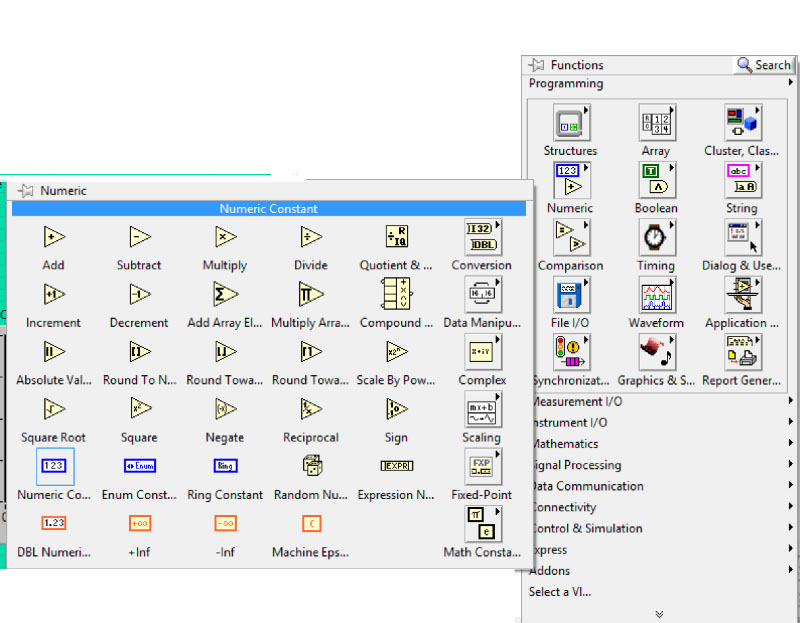
In the Controls Palette, choose Numeric / Numeric Indicator
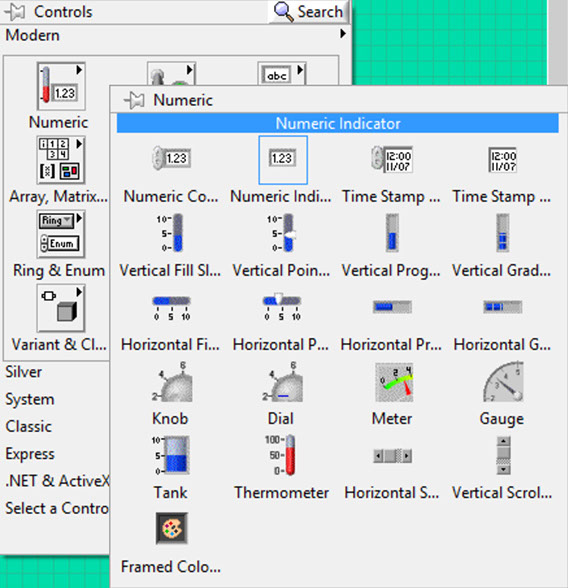
Change the name with temperature. Repeat The same with humidity
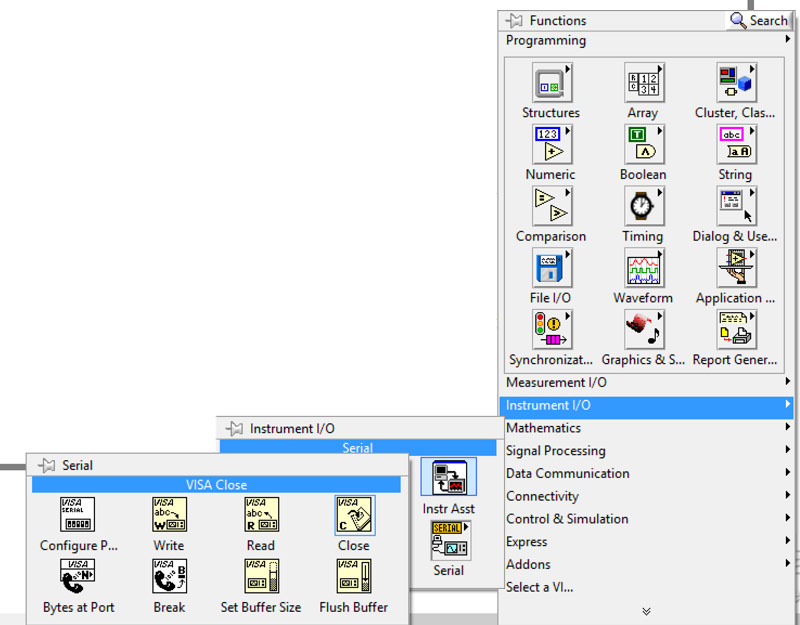
In the Control Palette
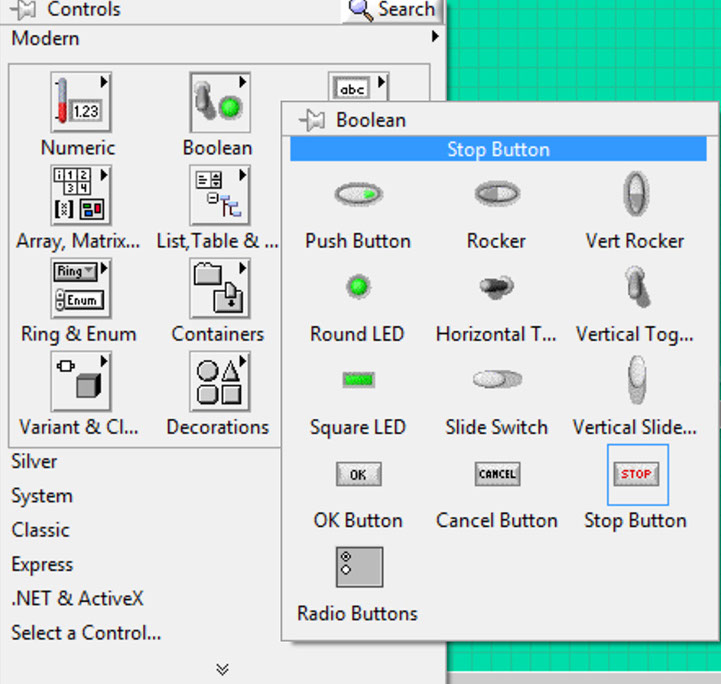
Place the STOP Button.
By the way, every time you want to see the other diagram you can go to the Windows/ Show Block Diagram
Continuing, choose the option Graph / Waveform Chart
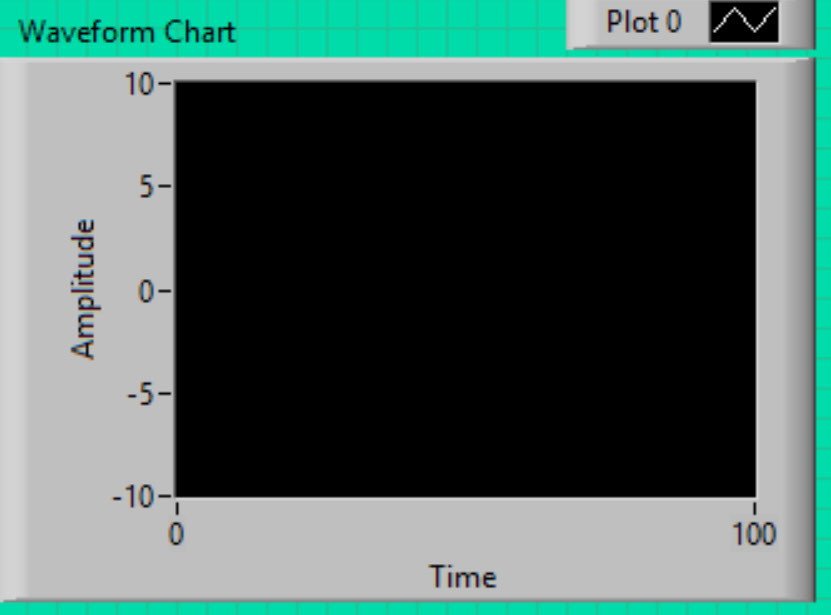
A field appears with Plot0, shift that field
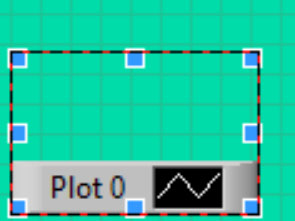
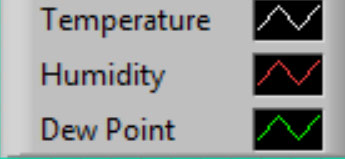
And rename the fields as Temperature, humidity and Dew Point
Put near the VISA resource name, that element was already there
In the block diagram, align these 3 last elements
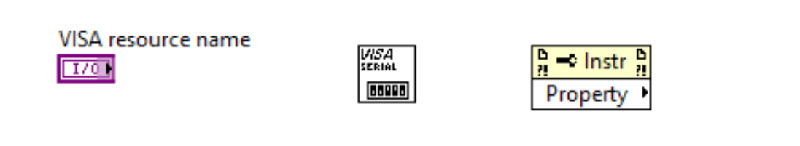
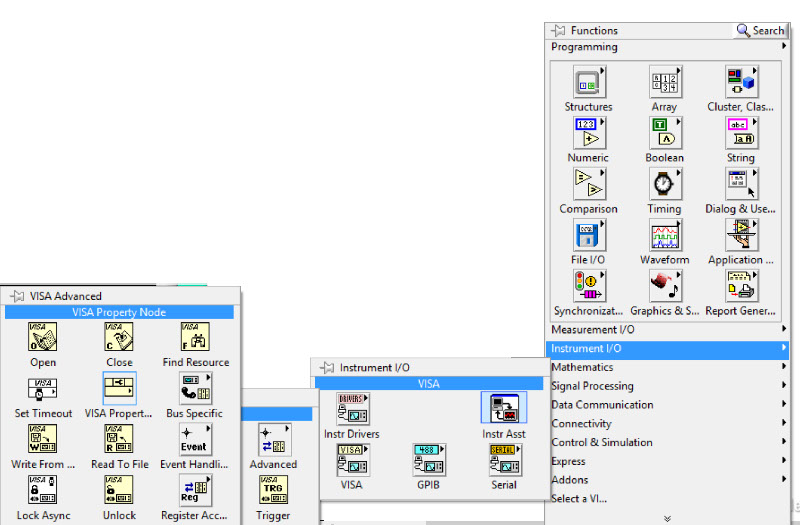
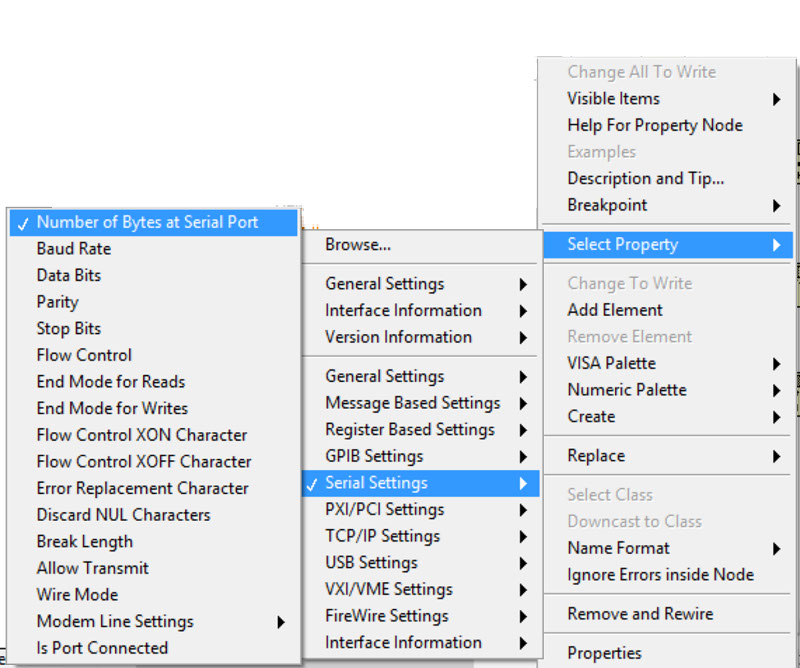
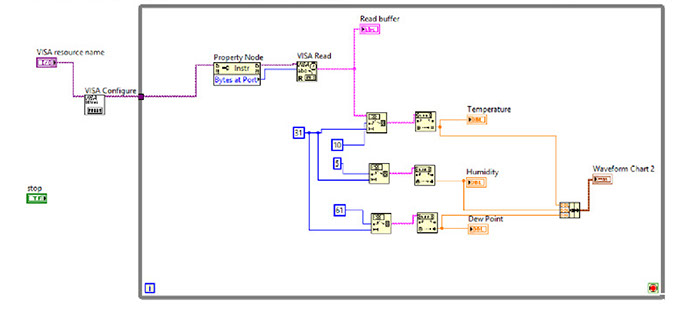
Right click on Property Node chose
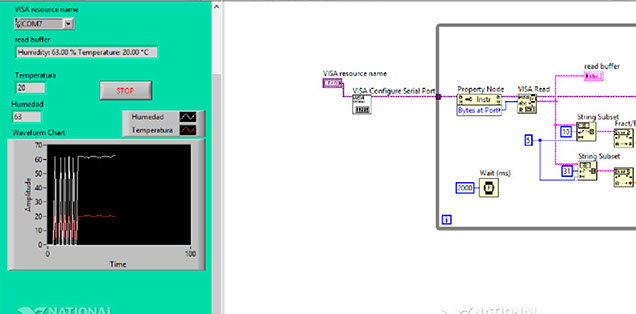
As the image show, the curve is not continuous.
Change the BAUD RATE in VISA CONFIGURE SERIAL PORT
Clicking it twice, I change from 9600 to 19200
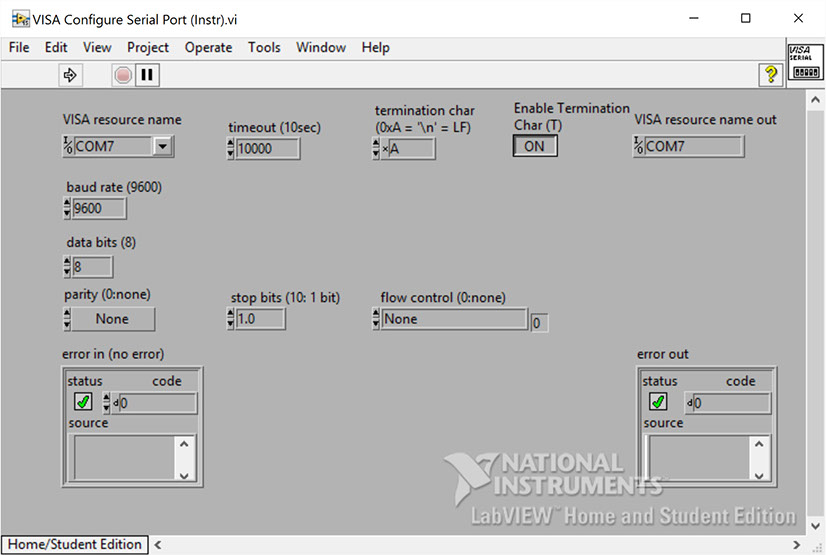
The curve becomes continous since I change the baud rate
The VI (Virtual Instrument) have been created. Its ready to be used.
Dew Point Monitoring System in Lab View
In this video you can see the the VI (Virtual Instrument) working with the congiguration mentioned, but inside the final project.
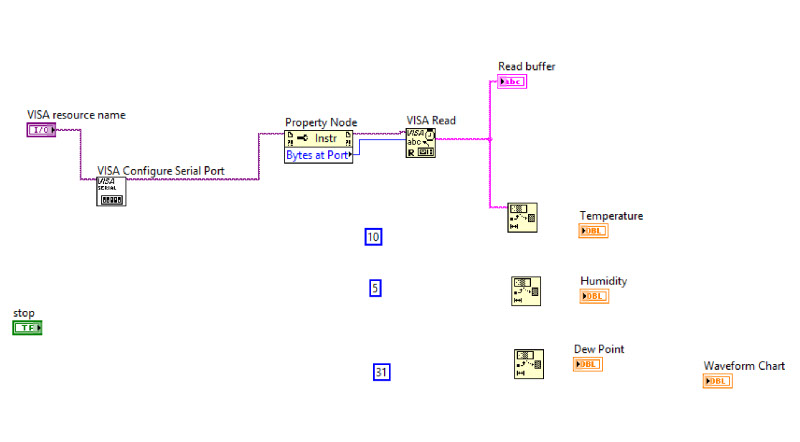
After pushing the VISA read control, we move the Read buffer that is already in the block diagram
Adding a string subset to read a text in a text chain
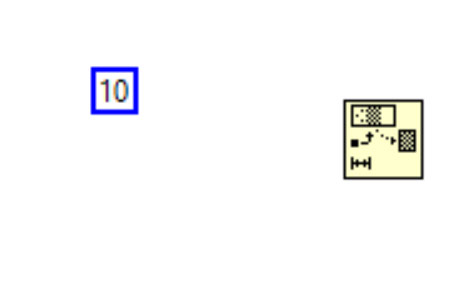
Adding a numeric constant
Write a value in the numeric constant
Doing the same three times for different values, depending on the position of the sting in the buffer
Wiring in the block diagram between elements. You can drag from the input/output pints of elements to others.
You can do this in the Block Diagram
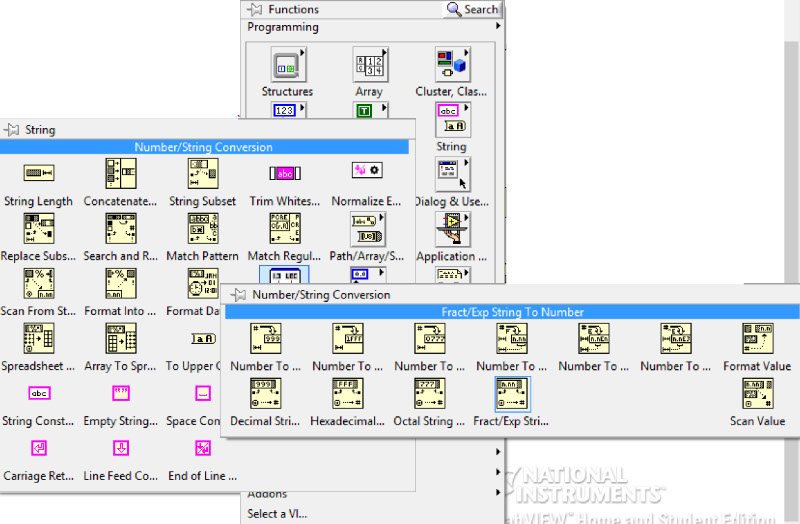
To convert a string to a number insert a bundle element:
Connect each element between cables with the same color
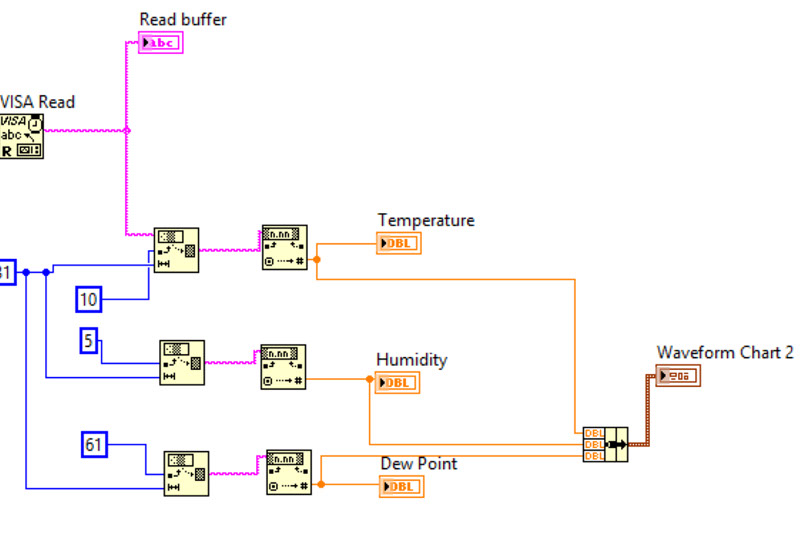
The entire model is like this
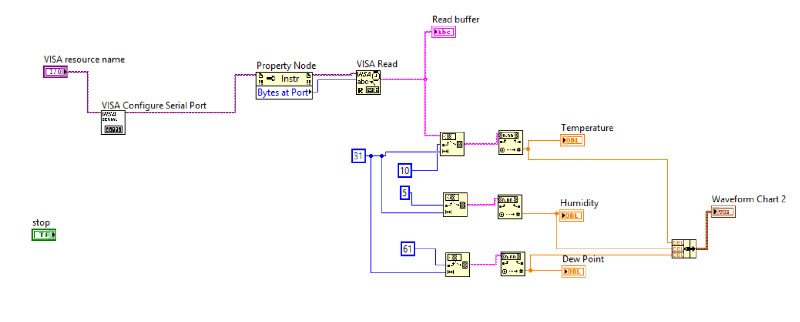
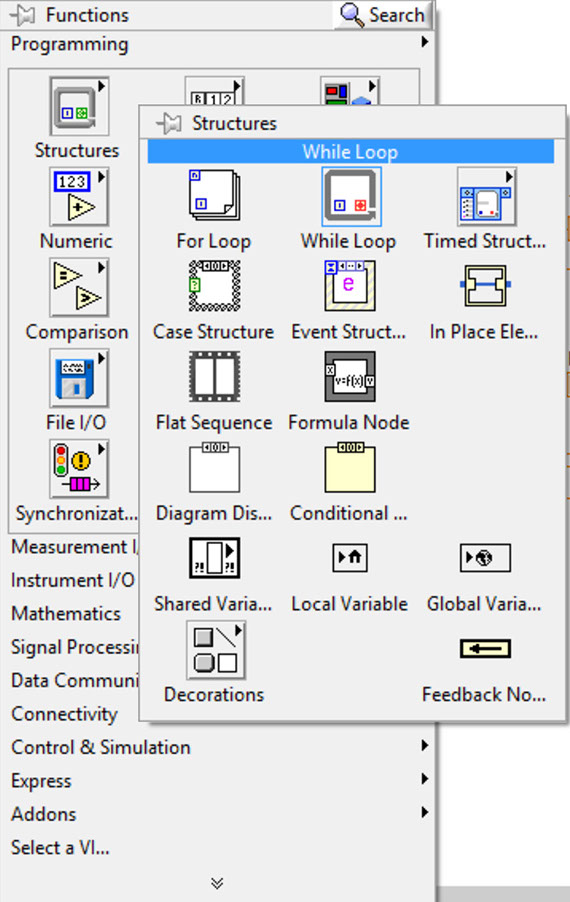
Next is to define a loop control
A timming for the loop
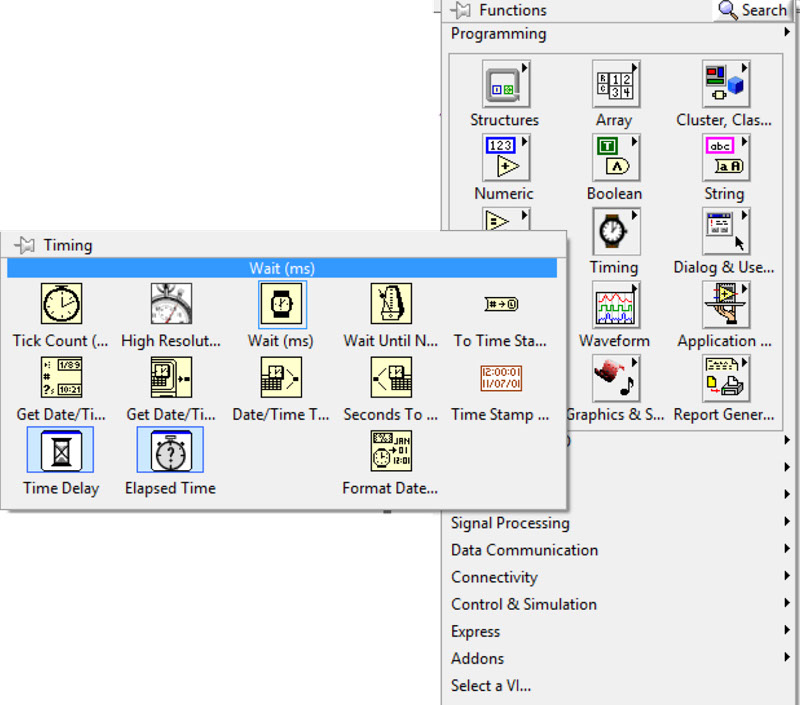
Add numeric constant 2000 (2 seconds) and connect
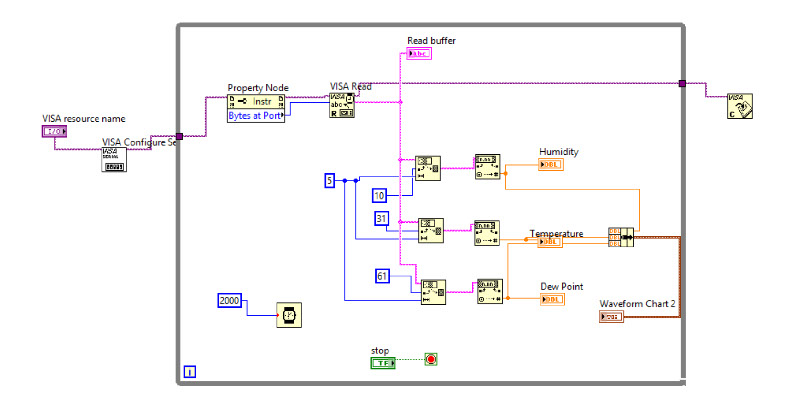
Connecting all components
Clock on the RUN arrow in the left top side of the Front Panel.
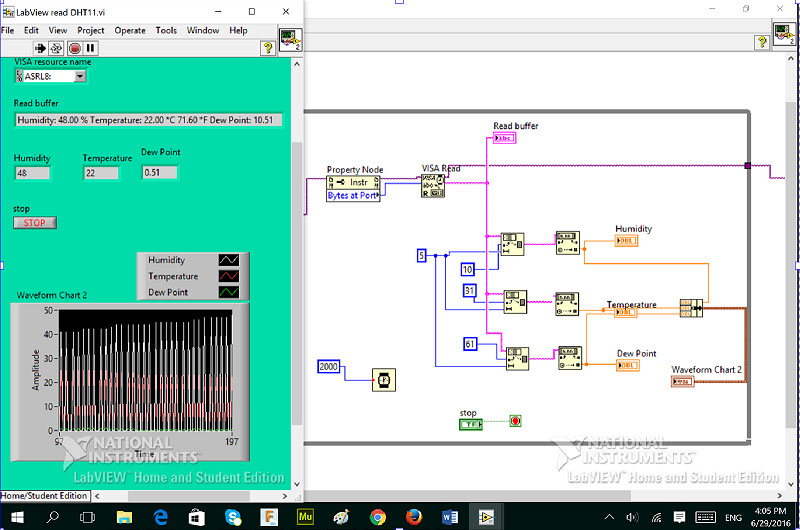
The signal was not looking continuos, I tried some adjustments, in the VISA COnfigure Serial Port. Changing the baud rate.