Wk16: 2016/05/18
INTERFACE AND APPLICATION PROGRAMMING
0. Assignments for wk16
The assignments for wk16 were as below;
- Write an application that interfaces with an input &/or output device that you made.
1. Practice: Connecting Test
Tutorial
This week, I used Processing to get familiar with interfaces programming, though I will not able to use Processing for my final project because it cannot use BLE connection.
Processing
I mainly refferred the tutorials below, through which I was able to understand how to communicate the board with Arduino and send the input data to application interfaces.
- Processing Basic and Quick Tutorial (Japanese)
- Processing Code Memo list
- How To Send tha value from Arduino to Processing (Japanese)
- Cordination between Arduino and Processing (1): Visulalizing the sensored data (Japanese)
- Cordination between Arduino and Processing (2): Visulalizing the chronological orderred data (Japanese)
Then, I set the goal of this week as below,
- Sendig the value from Accelerometer board, which I made in Input Device week, to Processing
- Visulalizing the data in real time
Practice 1: Testing the connection
In my first trial, I just examinned the connection between the board(Arduino side) and Processing, what I mean, not reading the value from the accelerometer. I wrote the simple Arduino code, which sent the value;"100" to Processing every 100 msec.
#includevoid setup() { Serial.begin(9600); } void loop() { Serial.write(100); delay(100); Serial.write(200); delay(100); }
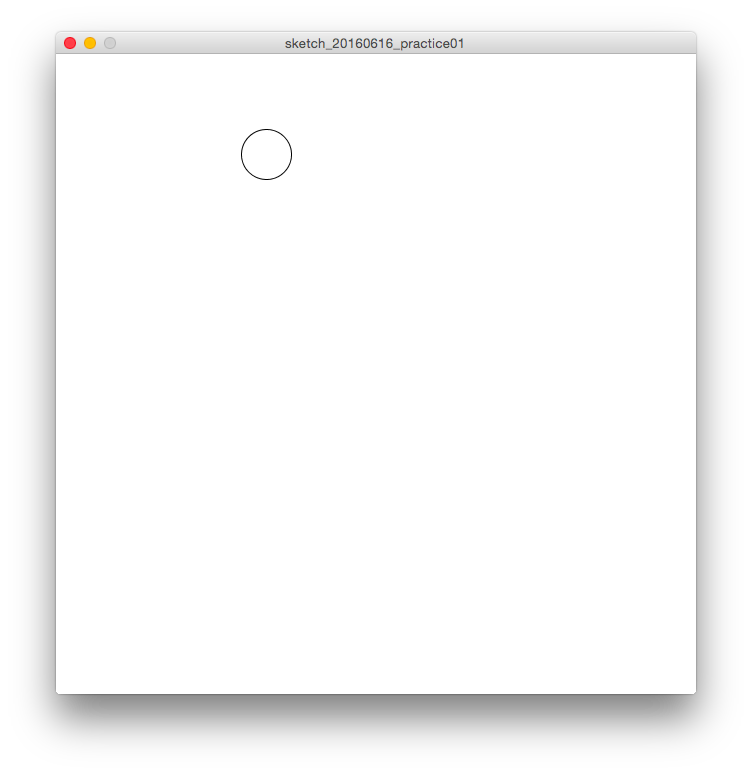
Second, I wrote the simple code for Processing, which only changed the position of the circle on the interface corresponding the value from Arduino, which is "0" or "100".
And what was to be pay attention to for this part is; when we usually send the value from the sensor to Serial Monitor on Arduino, we use Serial.print(). However, in this study, it is necessary to send the data of Byte format, so I have to write Srial.write() in this code.
Processing: sketch_20160616_practice01.pde
import processing.serial.*;

Serial myPort;
int x;

void setup() {
    size(640, 640);
    myPort = new Serial(this, "/dev/cu.usbserial-FT91COUK", 9600);
}

void draw() {
    background(255);
    ellipse(100 + x, 100, 50, 50);
}

void serialEvent(Serial p){
  x = p.read();
  println(x);
}
After several trials, I made it and found what was important for this study was detect the USB port correctly; "/dev/cu.usbserial-FT91COUK".
Connecting Test
(VIDEO) Connecting Test
Practice 2: Reading the value from the board
Next, I wanted to read the 3-axis value from the accelerometer board, so wrote the Aruduino code as below. Mainly, I used the code for Arduino side from the code which I wrote Input Device week.
Arduino: 20160616_practice02.ino
#includeint pin_x = 17; int pin_y = 18; int pin_z = 19; byte val_x = 0; byte val_y = 0; byte val_z = 0; void setup() { Serial.begin(9600); pinMode(pin_x, INPUT); pinMode(pin_y, INPUT); pinMode(pin_z, INPUT); } void loop() { val_x = analogRead(pin_x); val_y = analogRead(pin_y); val_z = analogRead(pin_z); Serial.write(val_x); Serial.write(val_y); Serial.write(val_z); delay(100); }
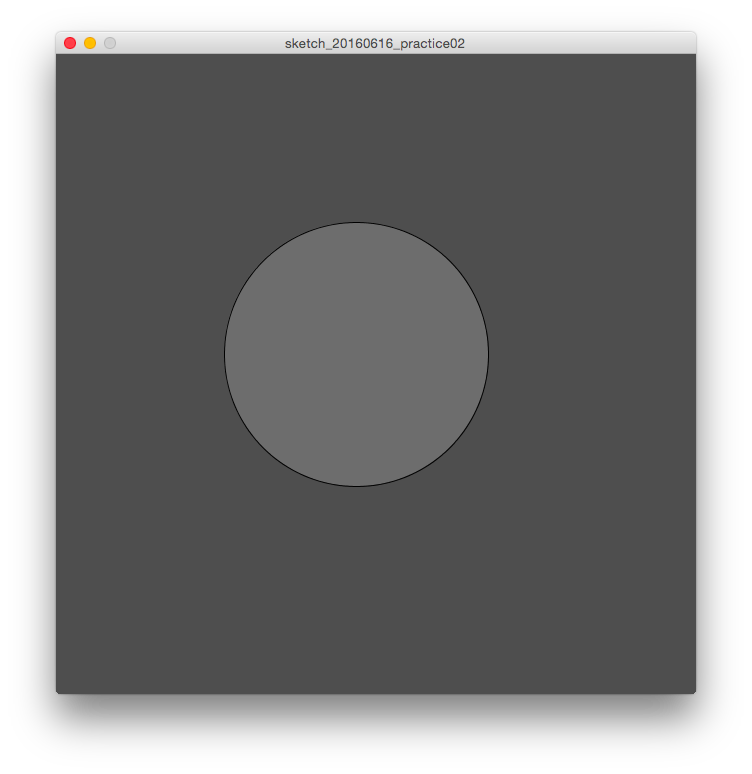
Second, I wrote the simple code for Processing, which changed the size and color of the circle corresponding with the value from Arduino as below.
What was hard for me and important on this process was to direct the board to read 3 types of data. In the code below, I wrote the code having the board read the 3-axis data at the same time on the module of serialEvent(Serial myPort).
Processing: sketch_20160616_practice02.pde
import processing.serial.*;

Serial myPort;

int in_x, in_y, in_z;

void setup() {
    size(640, 640);
    myPort = new Serial(this, "/dev/cu.usbserial-FT91COUK", 9600);
}

void draw() {
    background(in_x);
    fill(in_y);

    ellipse(300, 300, in_z*3, in_z*3);

}

void serialEvent(Serial myPort){
  if(myPort.available()>2){ // if receiving 3 data from serial (important!!)//
    in_x = myPort.read();
    in_y = myPort.read();
    in_z = myPort.read();
  }
}
Then, the result was below and I was able to send the data read by 3-axis accelerometersensor to the interface on laptop.
Moving ball with 3-axis data
(VIDEO) Moving ball with 3-axis data
2. Visulalizing the output from the board
For the next part, I tried to visualize the data as the graph.
Practice 3: Visulalizing the data as Line chart
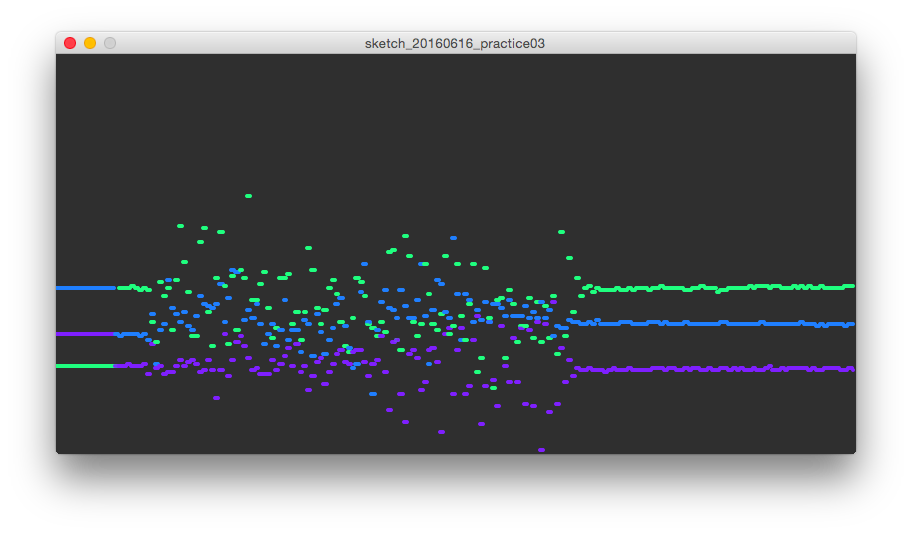
First, I made the code to make the line chart corresponding with the 3-axis data in real time.
For Arduino side, the code was same as that of Practice 2.
For Processing side, I wrote the code, refferring the Tutorials above.
Processing: sketch_20160616_practice03.pde
import processing.serial.*;

Serial myPort;

int in_x, in_y, in_z;
int cnt;

color[] col = new color[6];

void setup() {
  size(800, 400);
  frameRate(40);
  myPort = new Serial(this, "/dev/cu.usbserial-FT91COUK", 9600);
  initGraph();
}

void draw() {

  //x axis
  fill(col[1]);
  float tx1 = map(cnt, 0, width, 0, width);
  float ty1 = map(in_x, 0, 200, height, 0);
  ellipse(tx1, ty1, 4, 4);

  //y axis
  fill(col[2]);
  float tx2 = map(cnt, 0, width, 0, width);
  float ty2 = map(in_y, 0, 200, height, 0);
  ellipse(tx2, ty2, 4, 4);

  //z axis
  fill(col[3]);
  float tx3 = map(cnt, 0, width, 0, width);
  float ty3 = map(in_z, 0, 200, height, 0);
  ellipse(tx3, ty3, 4, 4);

  if (cnt > width) {
    initGraph();
  }

  cnt++;
}

void initGraph() {
  background(47);
  noStroke();
  cnt = 0;
  col[0] = color(255, 127, 31);
  col[1] = color(31, 255, 127);
  col[2] = color(127, 31, 255);
  col[3] = color(31, 127, 255);
  col[4] = color(127, 255, 31);
  col[5] = color(127);
}


void serialEvent(Serial myPort) {
  if (myPort.available()>2) { // if receiving 3 data from serial (important!!)//
    in_x = myPort.read();
    in_y = myPort.read();
    in_z = myPort.read();
  }
}
I succeeded to show the graph, however, the value from the accelerometer board was too fractuated to read effectively as below.
Line graph of 3-axis data
(VIDEO) Line graph of 3-axis data
Practice 4: Visulalizing the data as Bar chart
Since I found that the line graph was not suitable to visualize the 3-axis data from accelerometer board, I decided to make the bar chart corresponding with the value.
Also in this practice, the code on Aruduino was same as that of above. For Processing side, I wrote the code, in which the size of rectangles changed following the value from the sensor as below.
Processing: sketch_20160616_practice04.pde
import processing.serial.*;

Serial myPort;

int in_x, in_y, in_z;

color[] col = new color[6];

void setup() {
  size(700, 600);
  frameRate(40);

  myPort = new Serial(this, "/dev/cu.usbserial-FT91COUK", 9600);
  initGraph();
}

void draw() {
  background(255);

  line(0,500,700,500);
  fill(255);
  rect(100,100,100,400);
  rect(300,100,100,400);
  rect(500,100,100,400);

  //text
  fill(0);
  textSize(16);
  text("x-axis", 120, 550);
  text("y-axis", 320, 550);
  text("z-axis", 520, 550);
  textSize(20);
  text(in_x, 120, 50);
  text(in_y, 320, 50);
  text(in_z, 520, 50);

  //x axis
  fill(col[1]);
  float x = map(in_x, 0, 200, 0, 400);
  rect(100, 500-x, 100, x);

  //y axis
  fill(col[1]);
  float y = map(in_y, 0, 200, 0, 400);
  rect(300, 500-y, 100, y);

  //z axis
  fill(col[1]);
  float z = map(in_z, 0, 200, 0, 400);
  rect(500, 500-z, 100, z);

}

void initGraph() {
  col[0] = color(255, 127, 31);
  col[1] = color(31, 255, 127);
  col[2] = color(127, 31, 255);
  col[3] = color(31, 127, 255);
  col[4] = color(127, 255, 31);
  col[5] = color(127);
}


void serialEvent(Serial myPort) {
  if (myPort.available()>2) { // if receiving 3 data from serial (important!!)//
    in_x = myPort.read();
    in_y = myPort.read();
    in_z = myPort.read();
  }
}
Finally, I was able to visualize the data as bar chart, and was satisfied with the production, which can change the interface smoothly and quickly corresponding with the changing 3-axis values.
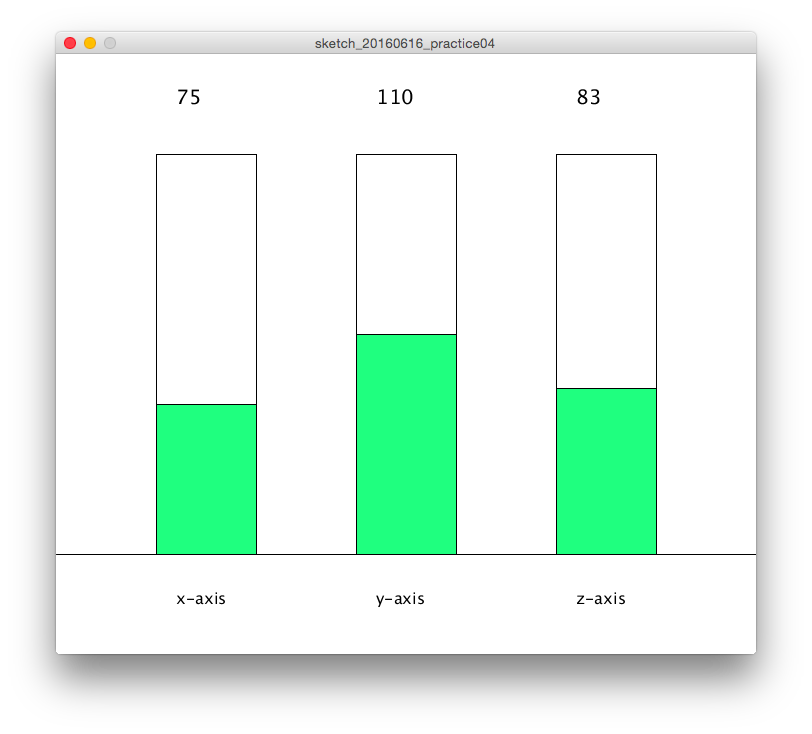
Bar chart with 3-axis data
(VIDEO) Bar chart with 3-axis data
Outline of this page
1. Practice: Connecting Test
2. Visulalizing the output from the board
Download output of wk16
Here are my output files for wk16:
(Practice01)
(Practice02)
(Practice03)
(Practice04)
Lecture Material for wk16
Lecture Note
Tools
- Processing
- Accelerometer Board (wk11)
- FTDI Cable
Learning Support
Videos of wk16
Here you can find this weeks's lectures on VIMEO:
(2016.05.18)
(2016.05.25)
Checklist for wk16
Assignments:
- Write an application that interfaces with an input &/or output device that you made.
Learning outcomes:
- Interpret and implement programming protocols
Have you:
- Described your process using words/images/screenshots.
- Explained the protocols you used
- Had a fun time
- Outlined problems and how you fixed them
- Included original code