Week 2 - Computer-Aided Design
Assignments
- model (raster, vector, 2D, 3D, render, animate, simulate, ...) a possible final project, and post it on your class page
Contents
GIMP
From paper sketch to raster draw with Gimp - Tutorial
A sketch on the paper is a perfect starting point for designing a project: it's fast, it's cheap, and forces you to think while writing down.
If you think that moving from the paper to a computer image is complex and time-consuming, you are wrong. You just need a smartphone, the GIMP Image Manipulation Software and a few minutes.
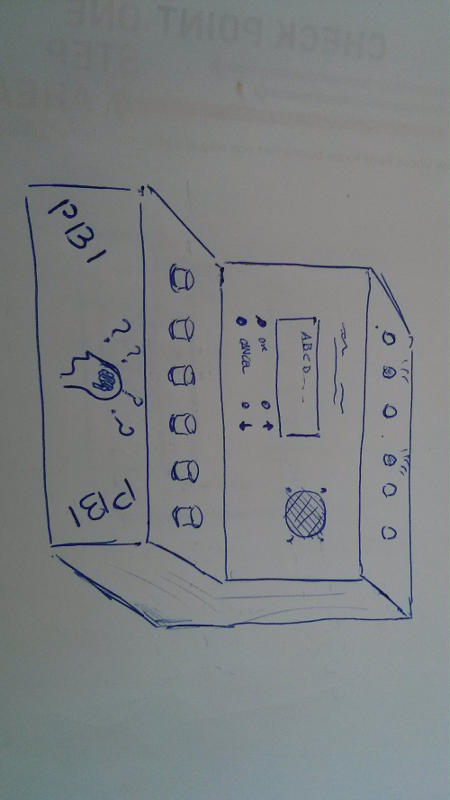
- Draw your sketch on the paper, then take a photo with your smartphone and download it onto you computer. The photo does not need to be perfect, something like this is perfectly fine:
- Now, download and install GIMP - GNU Image Manipulation Software
- Open the image from the menu with File --> Open...
- Rotate the image (if necessary) with Image --> Transform --> Rotate 90° clockwise / counter-clockwise.
- Now cut the image at the desired size: from the menu choose Tools --> Transform Tools --> Crop, then drag the mouse to select the interesting part image, finally click within the selection to crop useful part.
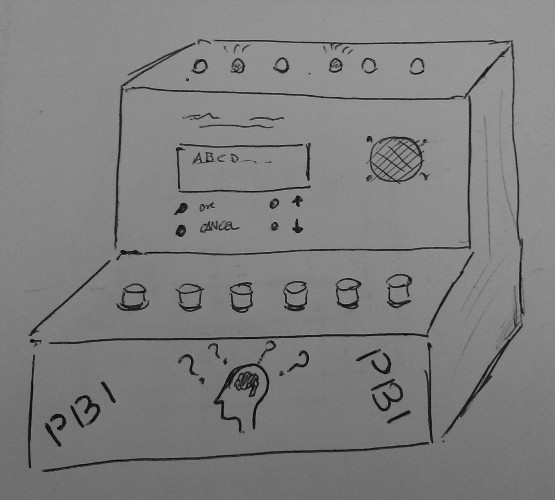
- It's a simple sketch, so let's get rid of the colors. Convert the image to grayscale with Image --> Mode --> Grayscale. At this point, you should have something like this:
- Use the Color tools to correct the image - with the Color tools you can manipulate image colors in several ways:
- modify the color balance,
- adjust hue, saturation and lightness,
- adjust brightness and contrast,
- change the intensity levels for a color channel,
- change color, brightness, contrast or transparency curves in a sophisticated way,
- ...
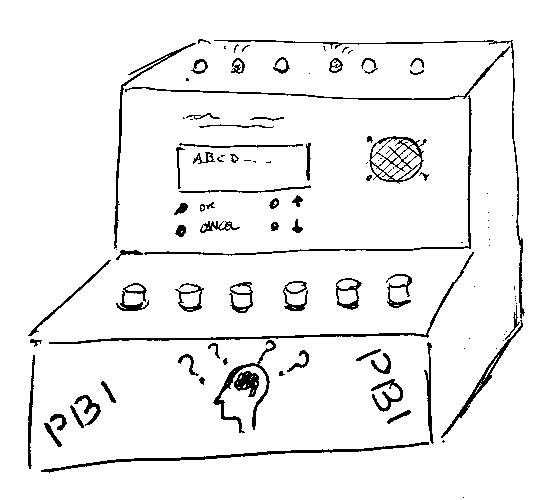
Set the threshold dragging left and right the arrows below the graph, and stop when the preview of the changes is satisfactory.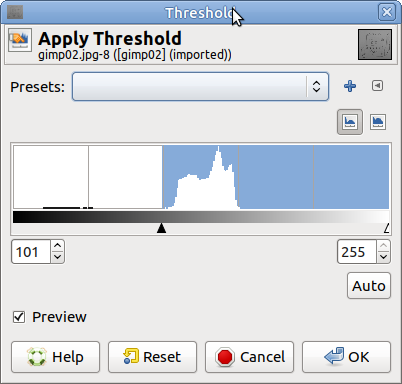
- Now resize the image: from Image menu select Scale Image... As for the resize options, set X/Y resolution of 72 pixel/inch and, a maximum width of 800 and a maximum height of 500 (change only one of them and GIMP will change the other dimension proportionally). You sketch is now ready to be saved:
- From File choose Export as... (yeah, not Save!), choose the directory, give the name a file ending with .jpg and click Export: a popup should appear asking you to set the quality. Remember that higher is better (and bigger!): 90-95% will be fine for you holiday photos, 70-75% is ok for tutorials like this one!
Inkscape
From raster to vector with Inkscape - Tutorial
With GIMP we exported a so-called raster image: rasters are made of pixels (the base element in a display) and they are are created with pixel-based programs or captured with a camera or a scanner. The most used format for rasters are jpg (lossy) or gif, png, and raw (lossless). On the other hand, a vector image is a mathematical representation of the image using point, lines and shapes.
A picture is worth a thousand words, so look at these two segments: 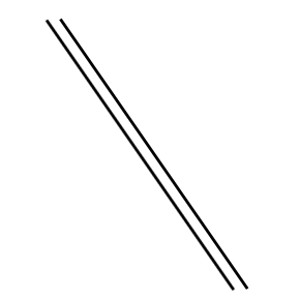 they look the same, but one of them is a raster and the other a vector image. Given what we saw above, if you zoom into a raster image you will start to see a lot of little tiny squares - the pixel - and the edges will blur. On the contrary, since a segment in vector graphic is just a conjunction between two points in the space, the graphic will always look the same while zooming in.
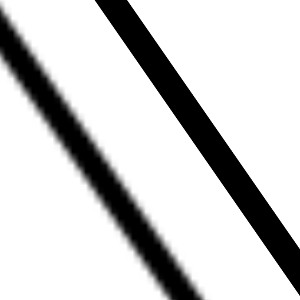 So which one is the raster? :-)
Vector graphics, which are created and handled with specific software, are typically used in Computer Aided Design, engineering, 3D graphics, and common for design that will be applied onto a physical product. Hence, learning vector design is crucial for understanding Computer-Controlled Cutting.
A widespread (and free) software for vector graphics is Inkscape. We are going to use Inkscape for transforming our sketch in a nice-looking, vector image. Inkscape includes a tool for transforming automatically raster into vector, transforming the edges of the image into lines.
For example, the result with black and white comics is often impressive: you can easily obtain a vector image of your favorite character and print it with laser with a very high resolution at any size. To make it clear, look at this picture:
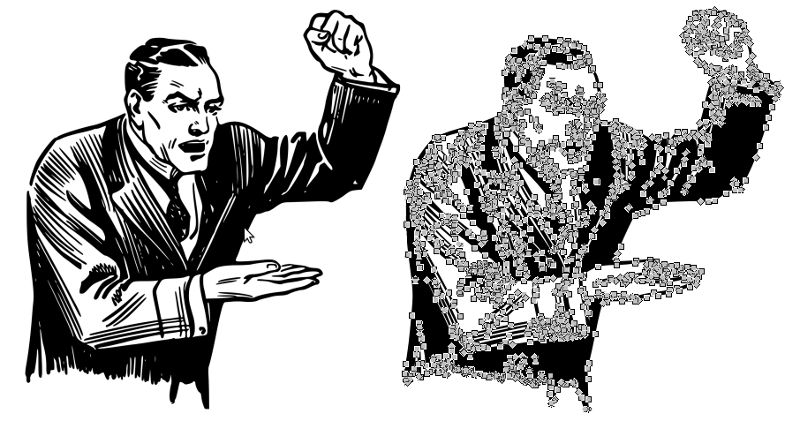 I downloaded this free raster png image and I converted it into a vector in Inkscape: as you can see, on the left side the vector image is nothing but series of points and lines connecting them (a sort of "connect the dots" game).
Let's try to do this conversion with our project sketch
- Download and install Inkscape
- Open Inkscape, and from the menu choose File --> Import and select the black and white raster image that you want to vectorize.
- Click on the image, then select Path --> Trace Bitmap. A window with many options will popup
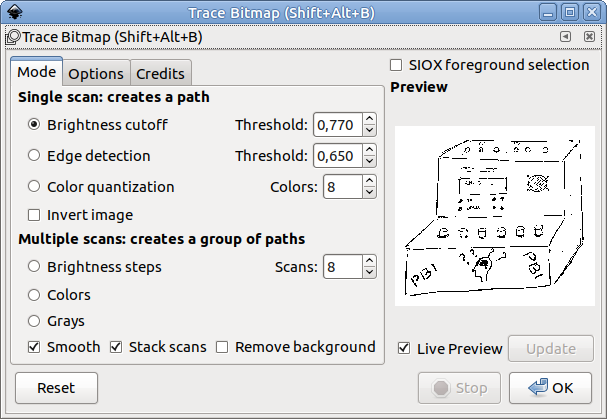
- Play a bit with the parameters: try with different single scan (for B/W images) or multiple scans (for grayscale) modes and try different thresholds. The Live preview will help you to choose an acceptable setup.
- The new vector image will overlap the raster one: separate them, delete the raster and keep the vector image.
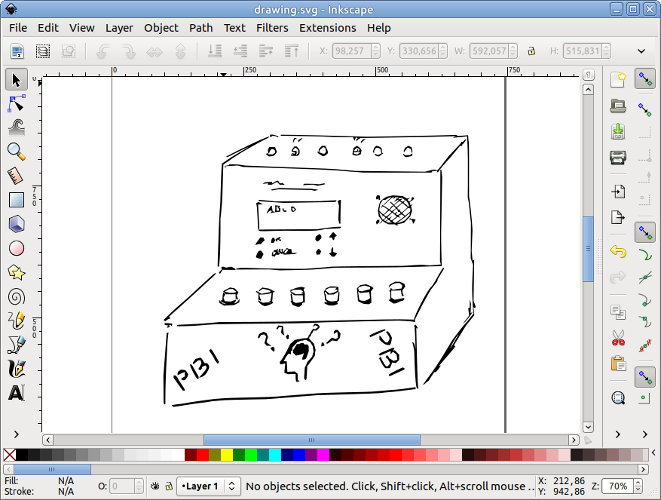
- Now you can save your file (SVG is the standard for vector image). If you want to have a look at my vectorized image you can download drawing1.svg.
As you can see, the vectorized image is clean but the lines are not straight, the buttons are not all equally spaced nor identical. This is corrected: we vectorized an hand drawn image, so the errors are still there. However, we could use our sketch as a background and draw a 'native' vector image on the top of it.
- Open the black-and-white raster image in GIMP
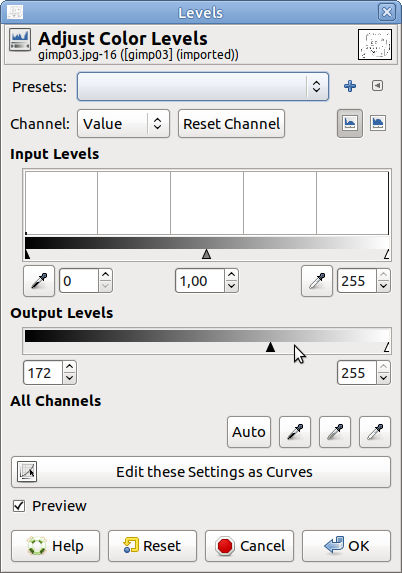
- Select Levels from menu Colors, then reduce the Output level of the dark pixel: the black pixel should become lighter, more bright. Save and close GIMP
- Open Inkscape and import the new background image
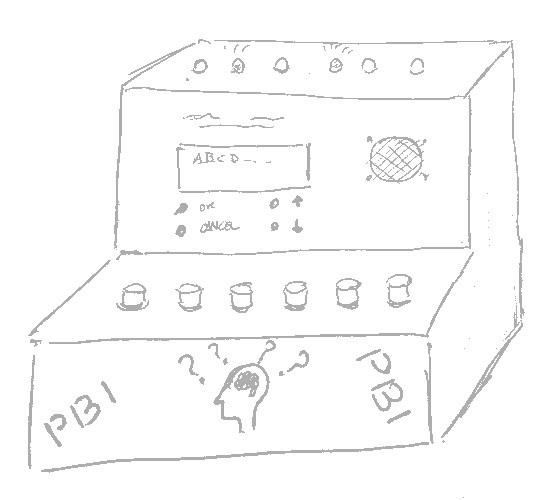
- Start drawing curves and straight lines using the gray image as a guide.
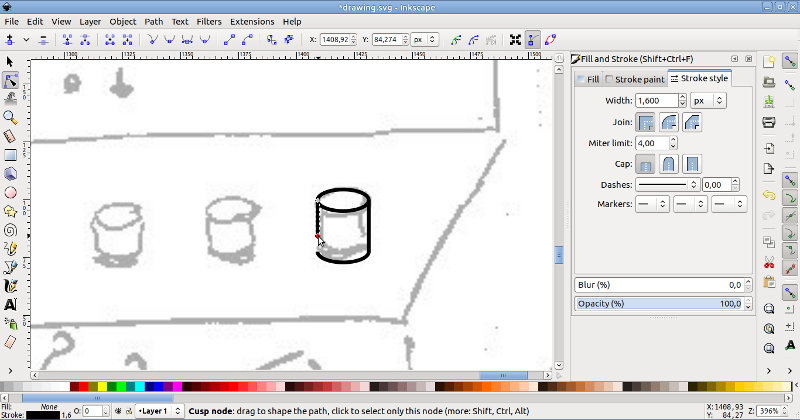
- TIPS:
- enable Snapping to join lines easily;
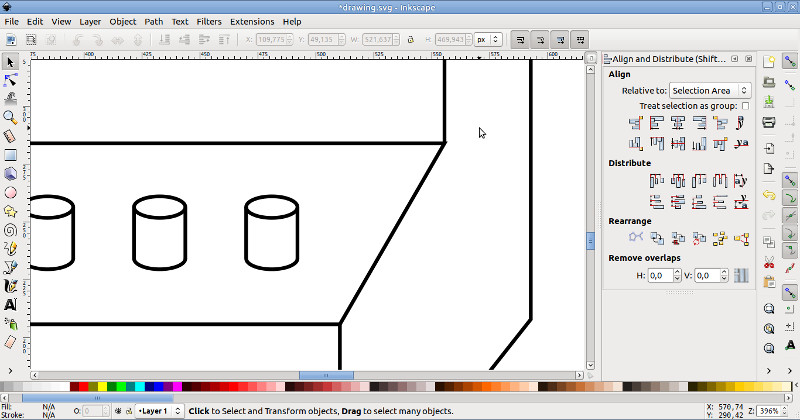
- for repeated elements (LEDs, buttons) draw all the parts of one element, group them, copy the element as many times as needed. Then use Align tool to align vertically/horizontally the elements and Distribute tool to equally space them;
- to create a semicircle you can create a circle, then Edit the nodes to split it into two parts, finally delete one half.
- Finally, remove the background image and leave only the vector one.
FreeCAD
Working with FreeCAD - A long journey fighting against a subtle bug
I started Friday using FreeCAD and designing in a parametric way, creating parts and defining the size of the elements with expressions, using a Spreadsheet for writing values and setting aliases for cells as parameters. I designed small parts, mainly for test, for about an hour: I set aliases, created expressions and played a bit with both of them. Then, I saved and closed everything. Later, I tried to reopen the design but everything was screwed up: missing values, wrong names for parts, etc.
So I tried to start a new design from scratch, but I ended again with a broken file.
I repeated the tests paying more attention to my edits: I defined the thickness of the material within the spreadsheet, and I set 'thickness' as the alias for this parameter. Then, I went on drawing and I set 'w' for the width of my box, 'hf' for the height of the front, and 'hb' for the height of the back. I went on drawing for a while, I saved, I closed and I re-opened the design. Everything seemed fine. I decided to change the alias for thickness, making it shorted. So I edited the spreadsheet and I changed the alias to 't'. Save, Close all, Open... and BOOM!
So, everything was a bit more clear now: changing the alias from 'thickness' to 't' raised a serious issue in FreeCAD! Ok, it took a few more trials and errors to realise what was going wrong, but I finally understood :-)
Firstly, I though the problem was related to 1-letter aliases, but nothing happened with 'a', 'b' and 'w'. So, 't' was probably a reserved word, or a sort of...
I downloaded the FreeCAD source code of the 0.16 release from GitHub, and from the terminal I run
grep -r "'t'" .
A few files were mentioning 't' and were related to spreadsheets and expression parsing. In a few cases, '\t' was considered as an escape sequence and a few additional checks and parsing operation were performed. Cool! I immediately tried n and r as aliases, but nothing happened. Hence, escaping was not anymore a candidate for the issue.
Another interesting file was FreeCADInit.py. I opened it: 't' was defined as a weight unit (tons). In the following line, another unit was 's' for second. I decided to reopen FreeCAD, changed one alias from 'height' to 's' and... it blew up again! Cool! I repeated the test with 'mA' and 'mol', and the issue appeared again.
Oh my dear, beloved bug... eventually I caught you!
The moral of the story...
I have filed a bug report for this issue: I hope the bug will be confirmed and solved in the next release. In the meantime, before choosing (and changing) an alias in the spreadsheet, check that you are not going to use a measurement unit!
Parametric 3D design with FreeCAD - Tutorial
FreeCAD is a parametric, open source 3D modeler tool. Its interface can be scaring at first: the UI is separated into workbenches -- a workbench is a collection of tools suited for a specific task, such as working with 3D parts, drawing 2D objects, creating a spreadsheet or defining a print drawing layout -- and you can switch among them.
Introduction to parametric design - a simple cube
Parametric design is extremely powerful. To put it simple, 'Parametric design' means that objects are defined to be parametric shapes associated with attributes -- intrinsic geometric parameters (length, width, depth etc.), position and orientation, etc. These attributes can be expressed as absolute values or through expressions referenced to other attributes (e.g., length = 2 * width). In addition, these attributes can refer to other attributes in the design.
Let's assume you want to design a cube -- a cube it's nothing but a rectangular prism having all its sides (length, width and height) equal. Hence, when we change the length, we would like to change automatically the width and the height accordingly.
So open FreeCAD, switch to the Parts workbench, draw the cube, double click on it on the features tree and edit it attributes:
- Length: will be our reference value
- Width: =Cube.Length
- Heigth: =Cube.Length
Now, try to change it length value: the other sizes will scale proportionally as well.
What this video (I recorded it with SimpleScreenRecorder) to see all the steps
and download the FreeCAD design file example1.fcstd
Introduction to parametric design - external references
We can also create a spreadsheet as a "database" where we store all the parameters, and reference all the object to it. The advantage of this approach is clear: we have a single point of storage for all the values, so it's easier to edit them.
Open FreeCAD, switch to the Spreadsheet workbench, insert the value in a cell, right click on this cell and set an alias (for example 'myval') for the parameter (it's a sort "variable" name). Then go back to Parts, open the cube and set:
- Length: =Spreadsheet.myval
- Width: =Spreadsheet.myval
- Heigth: =Spreadsheet.myval
Now, try to change the number within the spreadsheet cell: the cube will scale proportionally as well.
What this video to see all the steps
and download the FreeCAD design file example2.fcstd
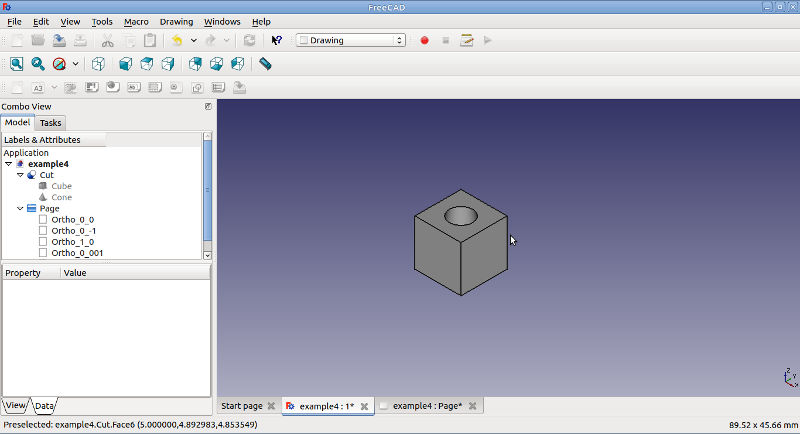
Parametric design - a cube with a hole
We can also set other attributes of our cube in a parametric way, like its position in the space. Moreover, we can create a pyramid and set its radius and height referring to the same 'myval' parameter seen before.
Finally, we can create a new shape combining two existing shapes through a cut (subtraction) operation, thus obtaining something like this:
What this video to see how to create it
and download the FreeCAD design file example3.fcstd.
Introduction to parametric design - Drawings
The Drawing module of FreeCAD allows you to put your 3D work on paper. That is, to put views of your models in a 2D window and to insert that window in a drawing. A drawing is useful, for example, to create a printable view of your design including a border, a title, your name/logo, the scale, etc.
For example, we can start from our design:
 and create a nice, printable first-angle orthographic projection with some notes:
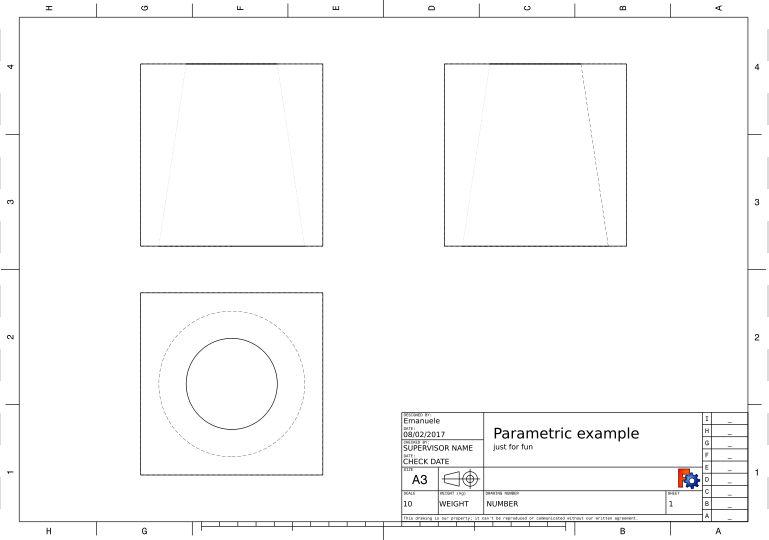 Eventually, you can print the drawing as a pdf
What this video to see how to setup a drawing view
and download the final FreeCAD design file example4.fcstd.
My final project
I designed my first final project idea in FreeCAD. The result is a box with buttons, LEDs and room for an LCD display
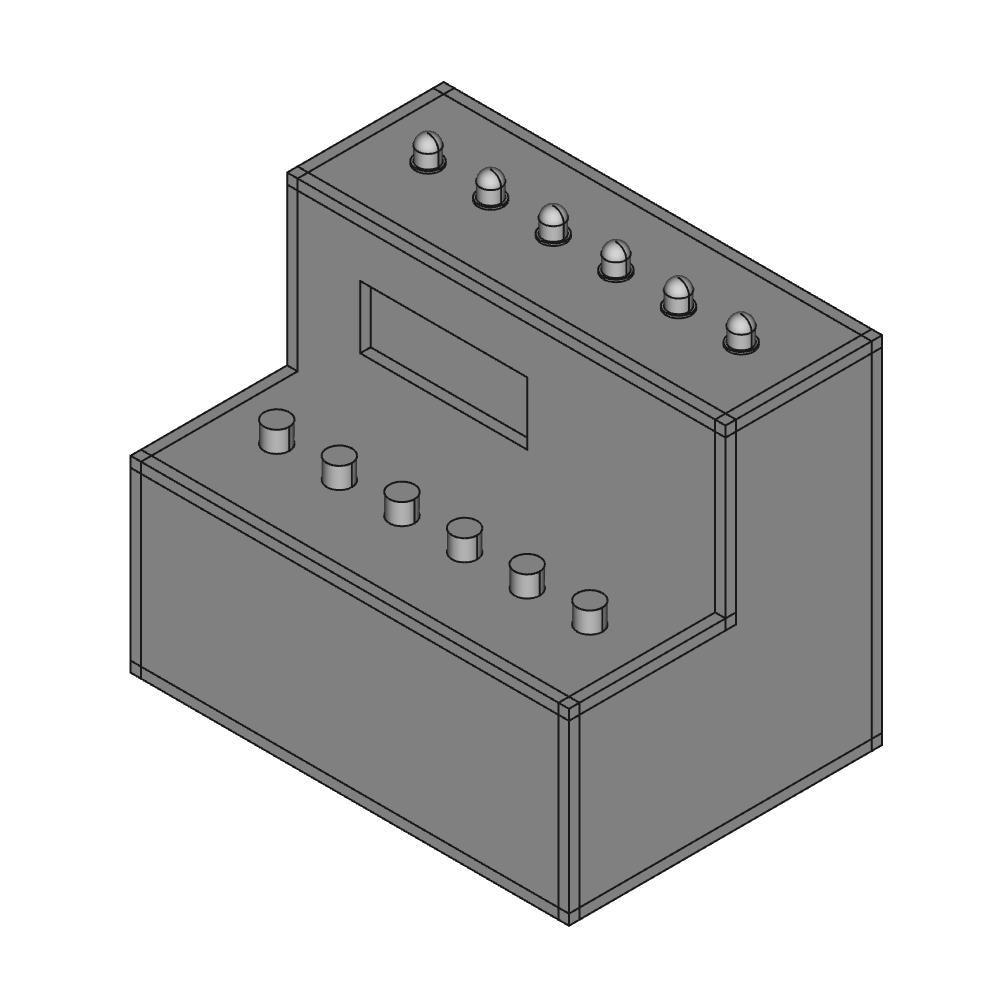 You can download the MyBox.fcstd FreeCAD file to open it, but I have exported it as an STL file which you can browse and rotate:
I created the design defining all the attributes in a spreadsheet: some are defined by the user, other (marked with '*') are computed automatically within the spreadsheet.
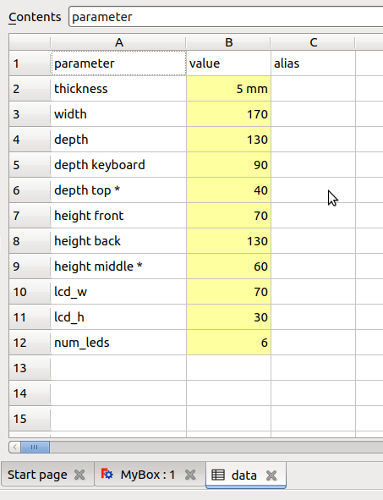
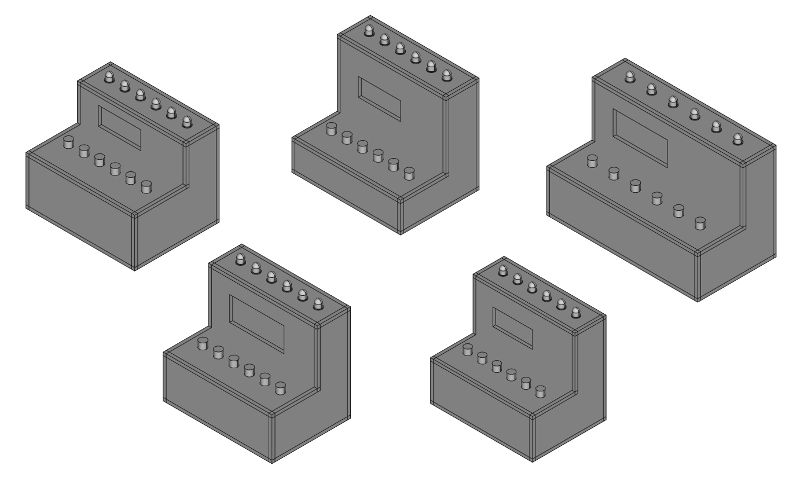
The advantage of using a parametric approach is that you can modify some values (height, width) and see how the case will look.
Exploded Assembly module
I tried to install and use the Exploded Assembly module - a workbench to create exploded views and animations of assemblies (follow the instruction on their home page for installation, then follow this video tutorial for learn how to use the module).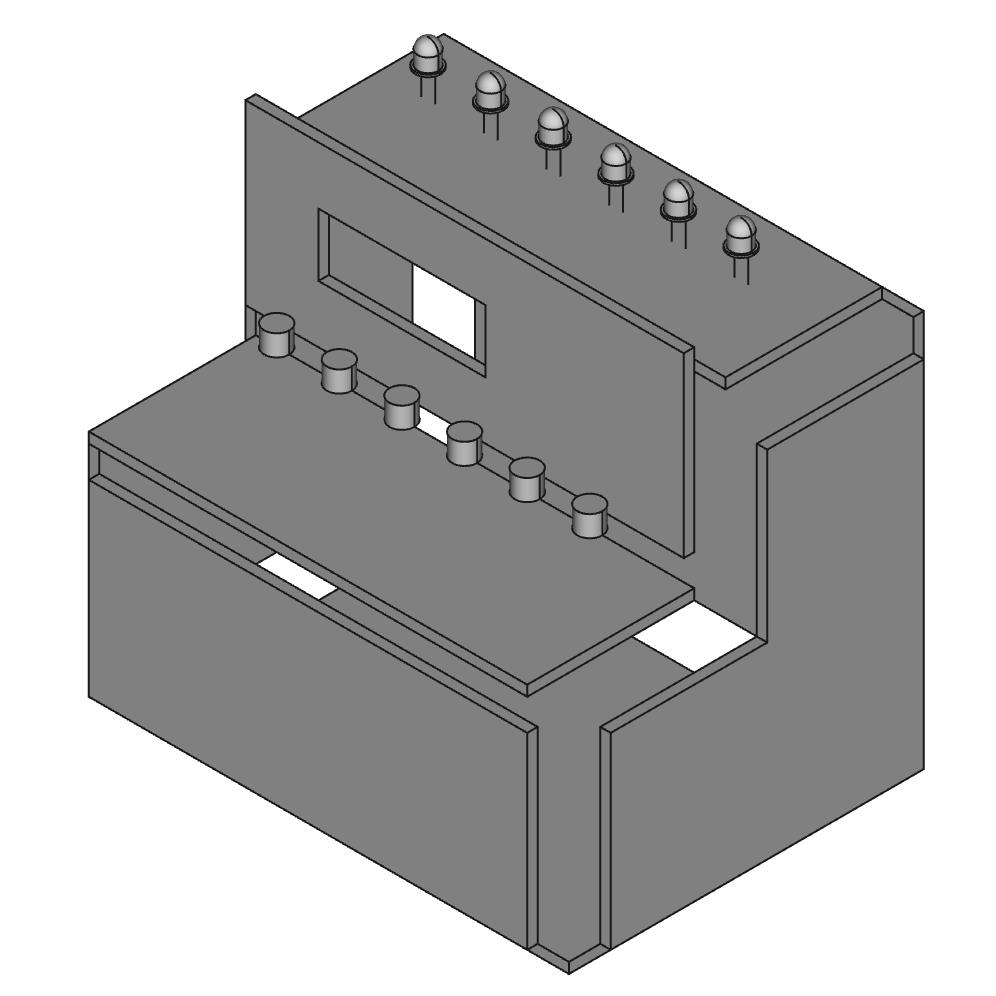 This module is perfect for nice-looking exploded views, but I had some issues with exploding trajectory lines - they cannot be modified and parametrized (at least from the UI). As a result, when you scale your design, the elements explodes in the original (and, often, unwanted) directions.
Antimony
Working with Antimony - Some notes
Antimony is a computer-aided design (CAD) tool which has taken a functional approach to design. The core of this tool is a framework for tracking information flow through directed acyclic graphs made of functional blocks - the outcome is rendered by a geometry engine for doing constructive solid geometry.
Antimony source code is freely (under MIT License) available on github.
Binary are provided for Mac users, by following these instructions I have been able to build and package it on Linux Ubuntu. If you want to try my antimony_0.9.3b-9-g48fdfc6_amd64.deb (20170217) amd64 debian package you can download it from here.
I have not been able to play enough with Antimony, but I have created a small proof of concept with dynamic generation of 3D points - you can set the number of points and the engine creates them - I have modified a bit the standard point node to accept a list. If you want to have a look the source code, download my points.sb file.
You can also modify the Python code of the nodes and create multiple shapes. For example, I have modified the default circle node creating a new node which dynamically generates a grid of NxM circles.
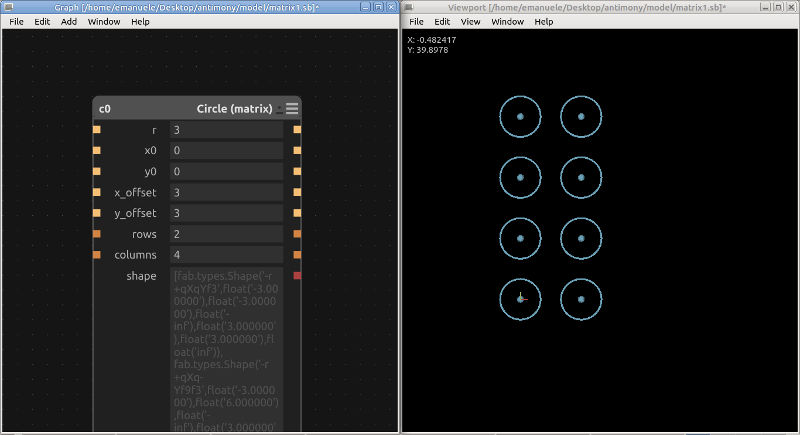 You can also split the operations on different nodes, but keep in mind that you have to modify all the nodes which handle lists of shapes or values. You can download my sample NxM circles generator (matrix1.sb) and, then, discover how I intersected multiple circles passing either lists of (x, y, r) triplets (matrix2.sb) or lists of native Antimony shapes (matrix3.sb).
Download zone - List of files
- drawing1.svg - SVG final project sketch
- example1.fcstd - FreeCAD example #1 (fcstd format)
- example2.fcstd - FreeCAD example #2 (fcstd format)
- example3.fcstd - FreeCAD example #3 (fcstd format)
- parametric1.stl - FreeCAD example #3 (stl format)
- example4.fcstd - FreeCAD example #4 (fcstd format)
- points.sb - Antimony dynamic 3D point (sb format)
- matrix1.sb - Antimony dynamic shapes #1 (sb format, include Python code)
- matrix2.sb - Antimony dynamic shapes #2 (sb format, include Python code)
- matrix3.sb - Antimony dynamic shapes #3 (sb format, include Python code)
- MyBox.fcstd - Final project design (FreeCAD fcstd format)
- MyBox.stl - Final project design (stl format)