Input devices
Assignment
Measure something: add a sensor to a microcontroller board that you have designed and read it.
For this week assignment. I will do two project. First I will design and make an Attiny 85 Temperature monitoring board. Connect it to a temperature sensor, read from it and display the result on an LCD display.
Next, I will do a project on image processing with OpenCV. That is to use a web cam as input device, connect it to a Linux OS microprocessor board, use Python programming language to perform some image processing such as colour and object tracking.
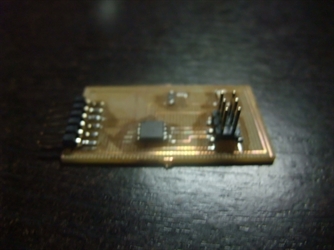
Attiny 85 water temperature monitoring system
The temperature monitoring system is used to monitor water temperatures at different location of a fish pond. It mainly consists of the following items:
- Attiny 85 microcontroller running at 8Mz internal clock
- Nokia 5110 graphic LCD display
- DS18b20 one-wire temperature sensor
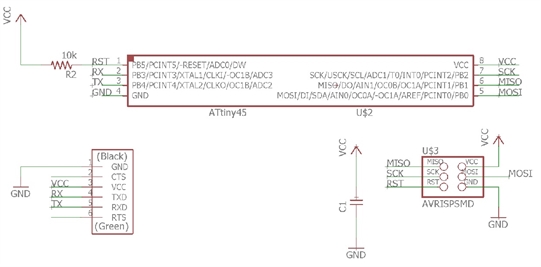
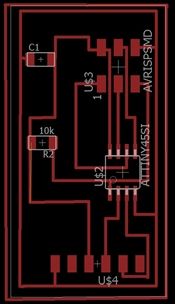
The schematic and board design were done using eagle PCB CAD software as shown below.
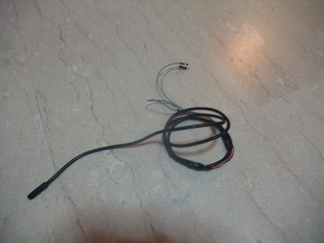
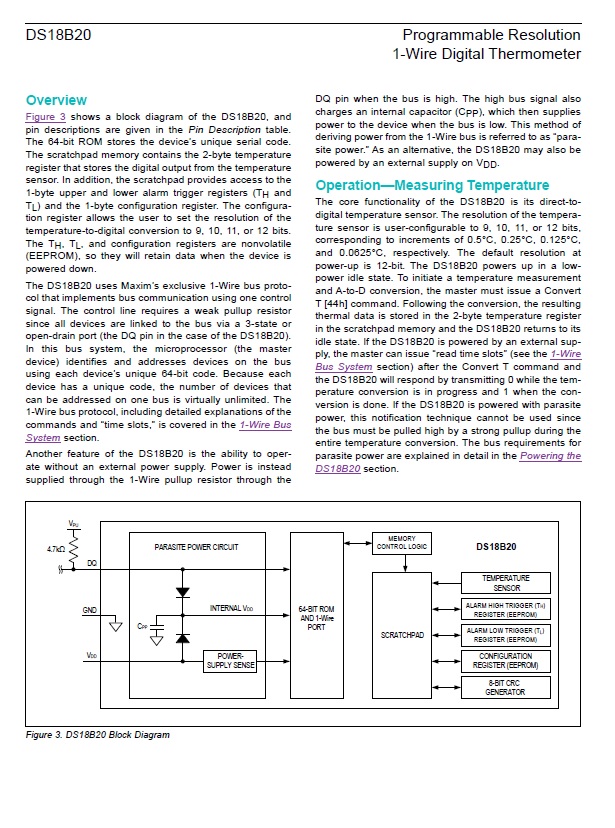
Also shown is the data sheet for DS18b20 temperature sensor. The sensor works on a onewire system such that a number of it can be connected to the same pin.
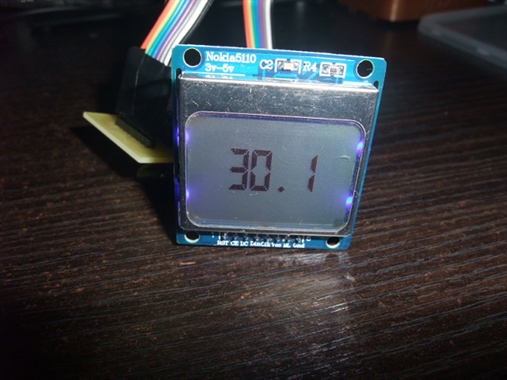
I have already described the use serial cmmunication from Attiny 85 to PC in my embedded programming assignment, so I will not repeat it here, rather I will make use of Nokia 5110 graphic LCD to display the teamperature reading.
I managed to find a water proof DS18b20 water sensor with the sensor encapsulated in plastic.
The temperature monitoring system is used to monitor water temperatures at different location of a fish pond. It mainly consists of the following items:
- Attiny 85 microcontroller running at 8Mz internal clock
- Nokia 5110 graphic LCD display
- DS18b20 one-wire temperature sensor
The schematic and board design were done using eagle PCB CAD software as shown below.
Also shown is the data sheet for DS18b20 temperature sensor. The sensor works on a onewire system such that a number of it can be connected to the same pin.
I have already described the use serial cmmunication from Attiny 85 to PC in my embedded programming assignment, so I will not repeat it here, rather I will make use of Nokia 5110 graphic LCD to display the teamperature reading.
I managed to find a water proof DS18b20 water sensor with the sensor encapsulated in plastic.

//Attiny 85 with DS18b20 onewire temperature sensor and Nokia 5110 Graphic LCD
//Original by : ΔΕΥΤΈΡΑ
//Modified by: Kenny phay
//Date: 12 Apr 2017 Rev 0
#include <OneWire.h>
#define ONEWIRE_BUSS 4
OneWire TemperatureSensor(ONEWIRE_BUSS);
#include
// SCK (CLK) - Attiny85 pin 5
// MOSI (DIN)------- Attiny85 pin 6
// DC (register select) - Attiny85 pin 7
// RST - Attiny85 pin 2
// CS (CE) - Attiny85 pin 4
// OneWire - Attiny85 pin 3
//LCD5110 myGLCD(0, 1, 2, 3, 6); //D6 don't exist - conect CS to GND
extern uint8_t BigNumbers[];
void setup(void) {
myGLCD.InitLCD();
myGLCD.clrScr();
}
void loop(void) {
myGLCD.setFont(BigNumbers);
byte i;
byte data[12];
int16_t raw;
float t;
TemperatureSensor.reset(); // reset one wire buss
TemperatureSensor.skip(); // select only device
TemperatureSensor.write(0x44); // start conversion
delay(1000); // wait for the conversion
TemperatureSensor.reset();
TemperatureSensor.skip();
TemperatureSensor.write(0xBE); // Read Scratchpad
for ( i = 0; i < 9; i++) { // 9 bytes
data[i] = TemperatureSensor.read();
}
raw = (data[1] << 8) | data[0];
t = (float)raw / 16.0;
myGLCD.printNumF(t, 1, CENTER, 14);
}
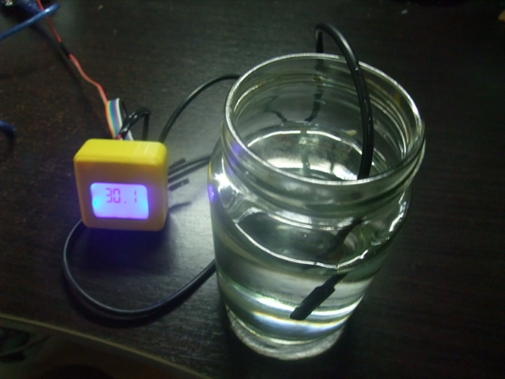
I also made a 3D printing housing for the LCD and PCBA modules to put everything together.
Image processing with OpenCV
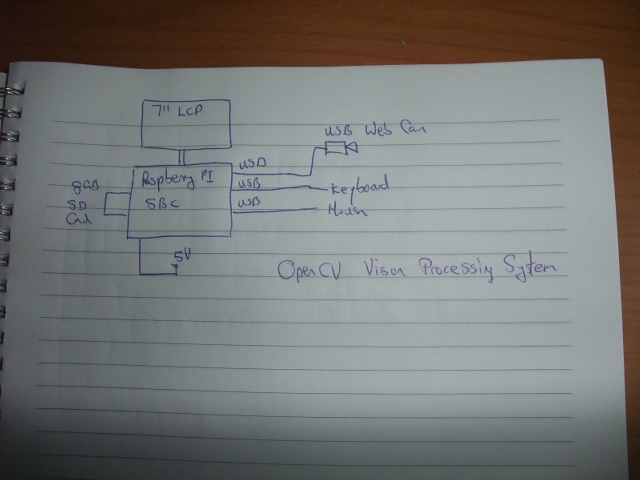
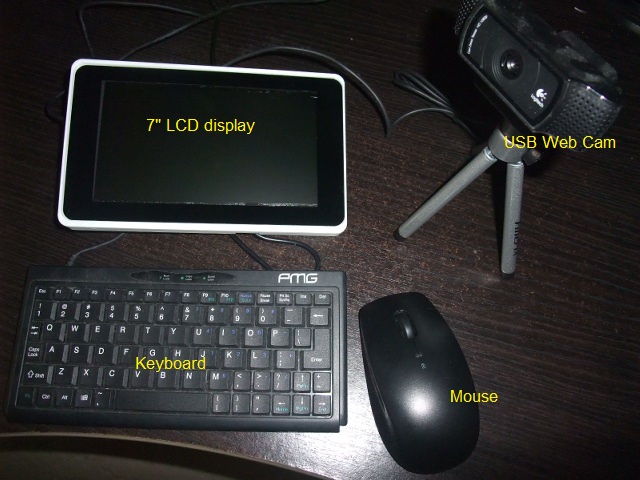
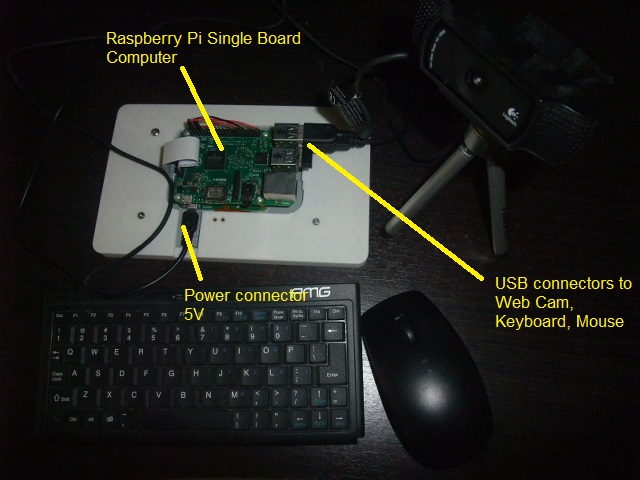
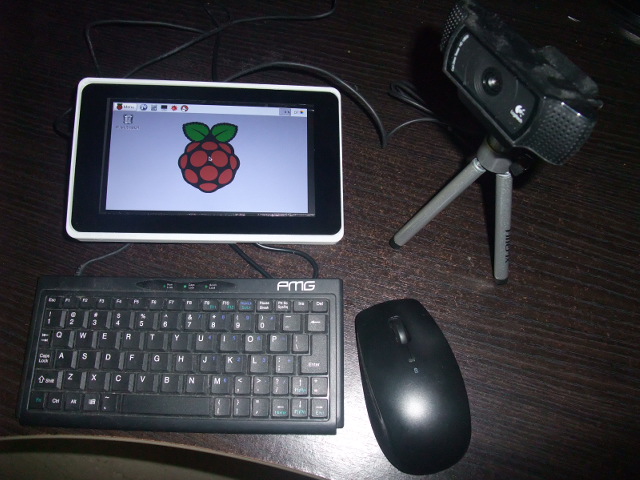
In the exercise, I will use a Raspberry Pi Single Board Computer running on Linux operating system (Rasbian – a form of Debian Linux). Attach a USB Web Cam to it. The Raspberry Pi will also connect to a 7” graphic LCD display together with a mouse and keyboard.
The image processing system runs on Python and the Image processing library is OpenCV.
OpenCV(Open Source Computer Vision) is a library of programming function mainly aimed at real-time computer vision. Originally developed by Intel’s research centre. The library is cross-platform and free for use under the open-source BSD license.
More information on OpenCV can be found from the following:
http://OpenCV.org
Things required to set up the system:
- Raspberry Pi Single Board Computer Rev 2 and above
- SD card 4GB loaded with Rasbian Linux OS
- USB Web Cam compatible with Linux OS
- 7” LCD display for Raspberry Pi
- USB keyboard and mouse
What is image processing
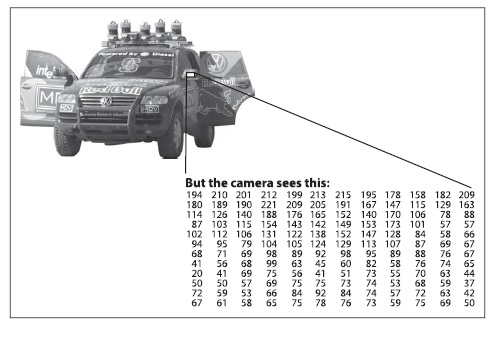
Image processing or computer vision is the transformation of data from a camera (see picture below) into either a
decision or a new representation. All such transformations are done for achieving some particular goal. Th e input data may include some contextual information such as “the camera is mounted in a car” or “laser range finder indicates an object is 1 meter away”. The decision might be “there is a person in this scene” or “there are 14 tumor cells on this slide”. A new representation might mean turning a color image into a grayscale image or removing camera motion from an image sequence.
In the exercise, I will use a Raspberry Pi Single Board Computer running on Linux operating system (Rasbian – a form of Debian Linux). Attach a USB Web Cam to it. The Raspberry Pi will also connect to a 7” graphic LCD display together with a mouse and keyboard.
The image processing system runs on Python and the Image processing library is OpenCV.
OpenCV(Open Source Computer Vision) is a library of programming function mainly aimed at real-time computer vision. Originally developed by Intel’s research centre. The library is cross-platform and free for use under the open-source BSD license.
More information on OpenCV can be found from the following:
http://OpenCV.org
Things required to set up the system:
- Raspberry Pi Single Board Computer Rev 2 and above
- SD card 4GB loaded with Rasbian Linux OS
- USB Web Cam compatible with Linux OS
- 7” LCD display for Raspberry Pi
- USB keyboard and mouse
What is image processing
Image processing or computer vision is the transformation of data from a camera (see picture below) into either a
decision or a new representation. All such transformations are done for achieving some particular goal. Th e input data may include some contextual information such as “the camera is mounted in a car” or “laser range finder indicates an object is 1 meter away”. The decision might be “there is a person in this scene” or “there are 14 tumor cells on this slide”. A new representation might mean turning a color image into a grayscale image or removing camera motion from an image sequence.
Instruction to set up raspberry Pi with Raspbian OS can be found here
https://www.raspberrypi.org/help/
The first thing you need to do it to install the openCv libraries onto your Raspberry Pi.
sudo apt-get install libopencv-dev python-opencv
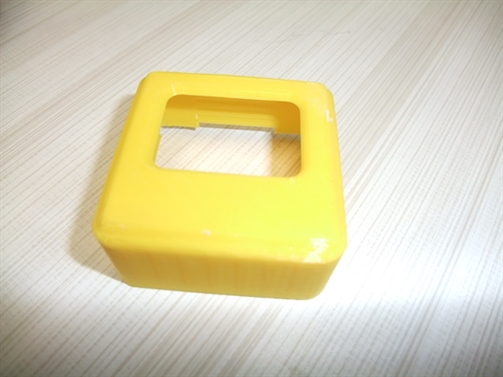
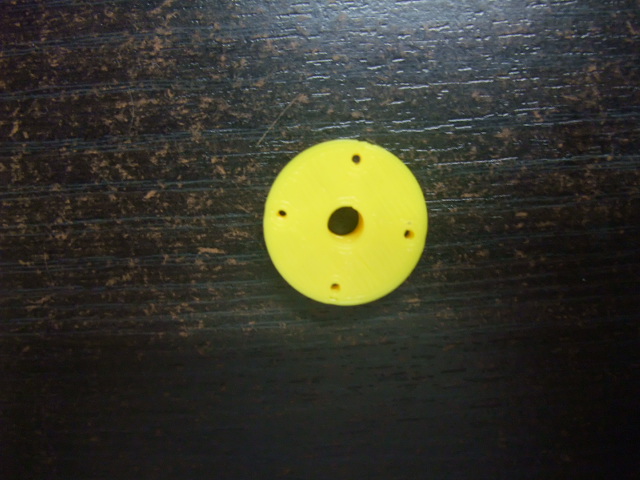
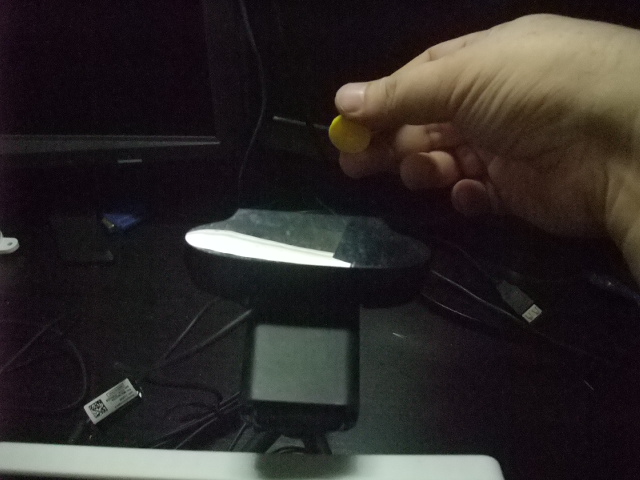
The object I use for vision tracking is this small yellow plastic disc about 1.5cm across.
https://www.raspberrypi.org/help/
The first thing you need to do it to install the openCv libraries onto your Raspberry Pi.
sudo apt-get install libopencv-dev python-opencv
The object I use for vision tracking is this small yellow plastic disc about 1.5cm across.
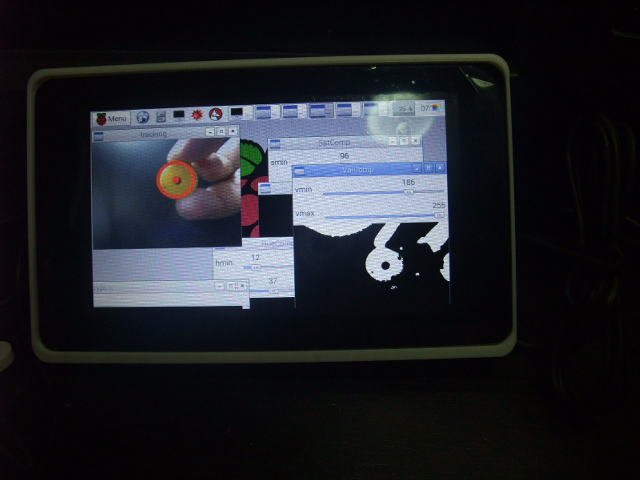
Here are some pictures on how the image processing track the yellow disc.
#OpenCV python object track program
#Original by : Trevor Appleton
#Modified by: Kenny for LCD screen use
import cv2
import cv2.cv as cv
import numpy as np
kernel = np.ones((5,5),np.uint8)
# Capture image from webcam
cap = cv2.VideoCapture(-1)
# Reduce the size of video to 320x240 so rpi can process faster
cap.set(3,320)
cap.set(4,240)
def nothing(x):
pass
# Creating a windows for later use
cv2.namedWindow('HueComp')
cv2.namedWindow('SatComp')
cv2.namedWindow('ValComp')
cv2.namedWindow('closing')
cv2.namedWindow('tracking')
# Creating track bar for min and max for hue, saturation and value
# You can adjust the defaults as you like
cv2.createTrackbar('hmin', 'HueComp',12,179,nothing)
cv2.createTrackbar('hmax', 'HueComp',37,179,nothing)
cv2.createTrackbar('smin', 'SatComp',96,255,nothing)
cv2.createTrackbar('smax', 'SatComp',255,255,nothing)
cv2.createTrackbar('vmin', 'ValComp',186,255,nothing)
cv2.createTrackbar('vmax', 'ValComp',255,255,nothing)
# My experimental values
# hmn = 14
# hmx = 45
# smn = 155
# smx = 255
# vmn = 186
# vmx = 255
while(1):
buzz = 0
_, frame = cap.read()
#converting to HSV
hsv = cv2.cvtColor(frame,cv2.COLOR_BGR2HSV)
hue,sat,val = cv2.split(hsv)
# get info from track bar and appy to result
hmn = cv2.getTrackbarPos('hmin','HueComp')
hmx = cv2.getTrackbarPos('hmax','HueComp')
smn = cv2.getTrackbarPos('smin','SatComp')
smx = cv2.getTrackbarPos('smax','SatComp')
vmn = cv2.getTrackbarPos('vmin','ValComp')
vmx = cv2.getTrackbarPos('vmax','ValComp')
# Apply thresholding
hthresh = cv2.inRange(np.array(hue),np.array(hmn),np.array(hmx))
sthresh = cv2.inRange(np.array(sat),np.array(smn),np.array(smx))
vthresh = cv2.inRange(np.array(val),np.array(vmn),np.array(vmx))
# AND h s and v
tracking = cv2.bitwise_and(hthresh,cv2.bitwise_and(sthresh,vthresh))
# Some morpholigical filtering
dilation = cv2.dilate(tracking,kernel,iterations = 1)
closing = cv2.morphologyEx(dilation, cv2.MORPH_CLOSE, kernel)
closing = cv2.GaussianBlur(closing,(5,5),0)
# Detect circles using HoughCircles
circles = cv2.HoughCircles(closing,cv.CV_HOUGH_GRADIENT,2,120,param1=120,param2=50,minRadius=10,maxRadius=0)
# circles = np.uint16(np.around(circles))
#Draw Circles
if circles is not None:
for i in circles[0,:]:
# If the ball is far, draw it in green
if int(round(i[2])) < 30:
cv2.circle(frame,(int(round(i[0])),int(round(i[1]))),int(round(i[2])),(0,255,0),5)
cv2.circle(frame,(int(round(i[0])),int(round(i[1]))),2,(0,255,0),10)
# else draw it in red
elif int(round(i[2])) > 35:
cv2.circle(frame,(int(round(i[0])),int(round(i[1]))),int(round(i[2])),(0,0,255),5)
cv2.circle(frame,(int(round(i[0])),int(round(i[1]))),2,(0,0,255),10)
buzz = 1
#you can use the 'buzz' variable as a trigger to switch some GPIO lines on Rpi :)
# print buzz
# if buzz:
# put your GPIO line here
#Show the result in frames
cv2.imshow('HueComp',hthresh)
cv2.imshow('SatComp',sthresh)
cv2.imshow('ValComp',vthresh)
cv2.imshow('closing',closing)
cv2.imshow('tracking',frame)
k = cv2.waitKey(5) & 0xFF
if k == 27:
break
cap.release()
cv2.destroyAllWindows()
The steps for tracking the yellow object are indicated within the coding and can be summarised as follow
1. Capture image from Web Cam
2. Reduce image size to aid processing
3. Convert image to HSV (hue, saturation,value)
4. Perform thresholding
5. Use circle detection algorithm
6. Draw circle on item found
1. Capture image from Web Cam
2. Reduce image size to aid processing
3. Convert image to HSV (hue, saturation,value)
4. Perform thresholding
5. Use circle detection algorithm
6. Draw circle on item found
Reflection
Input devices are sensors enabling a microcontroller to detect, monitor and measure various external parameters. sensors like temperature sensor or light sensor are simple to monitor as they require less processing power. Image processing on the other hand require much more back end processing.
Input devices are sensors enabling a microcontroller to detect, monitor and measure various external parameters. sensors like temperature sensor or light sensor are simple to monitor as they require less processing power. Image processing on the other hand require much more back end processing.